Do you want to make complex data understandable for users? Do you need technical expertise to build visualisations that meet your needs? Our developers transform data into visually appealing graphs, interactive maps, and comprehensible dashboards.
Why is visualising data smart?
In today's world, where data plays a crucial role in decision-making and business strategies, visualising data is essential. Raw data is often hard to comprehend, and hidden patterns or insights can go unnoticed. By visualising data, you simplify complex information, uncover trends, and understand patterns. This enables you to make better decisions and seize opportunities that you might otherwise overlook.
Data Visualisation by De Voorhoede: what do you get?
A customized visualisation that aligns with your needs and brand identity
Integration between the visualisation and existing systems, such as your CRM or ERP
Optimal data security for (sensitive) information
An interactive visualisation that allows users to work with the data and discover insights
A team of experts for development and a project manager ensuring timely and budget-friendly delivery
Life Terra
Plant trees to help restore our planet
15 Apps for water research at Deltares
In 3 years, 15 apps for water research
ViriCiti
View and monitor the charging status of electric buses
Geldmaat
Optimising reusability for new online presence

Get to know De Voorhoede
We're here to help you visualise your data. Contact Jasper for an introduction.
Datavisualisation in 5 steps
When you work with us to visualise your data, we go through 5 steps together.
Analysis of your data and needs
We begin with a comprehensive analysis of your data and specific requirements. This helps us determine the best approach and identify visualisations that are most suitable for your objectives. We select the technology that fits your application best. Does it work better with interactive SVGs, a canvas, or WebGL? Do we use standard web technology or is a library like Three.js or Mapbox more convenient? How do we ensure smooth and intuitive functionality, even with large amounts of data
Collaboration with design partners
Our talented developers collaborate with our design partners (Valsplat, Hike One, or Edenspiekermann) for an optimal end result. By combining the creativity of designers with our technical expertise, we create data visualisations that are both informative and appealing. Together we define the visualisation's purpose, optimal information density, suitable interaction patterns, and ensure accessibility.
Interactive applications
We go beyond static graphs and tables. Our interactive maps or dashboards allow you to play with your data, explore different scenarios, and gain profound insights with just a few clicks.
Responsive visualisations
Whether you're viewing the data on a desktop, tablet, or smartphone, our visualisations adapt to any screen size, ensuring clarity and readability.
Support and updates
Our commitment doesn't end with delivering the visualisations. We provide ongoing support, maintenance, and updates to keep your data visualisations accurate and up-to-date.
Examples of data visualisation
Playing this video requires sharing information with YouTube.
https://www.youtube.com/watch?v=GW6-2cqe1GsPolitiek Woordenspel - Analysis of worduse in airtime for political parties
We created this interactive data visalisation for ReFrame, a collaboration project of Beeld & Geluid, lectureship Creative Media for Social Change (University of Applies Sciences in Amsterdam) and Utrecht Universtiy. It shows a bubble chart and a timeline of what words were mentioned, in what year, by which party in the political airtime in The Netherlands. The researchers of this project invite everybody to play with the data and share interesting insights with the public.
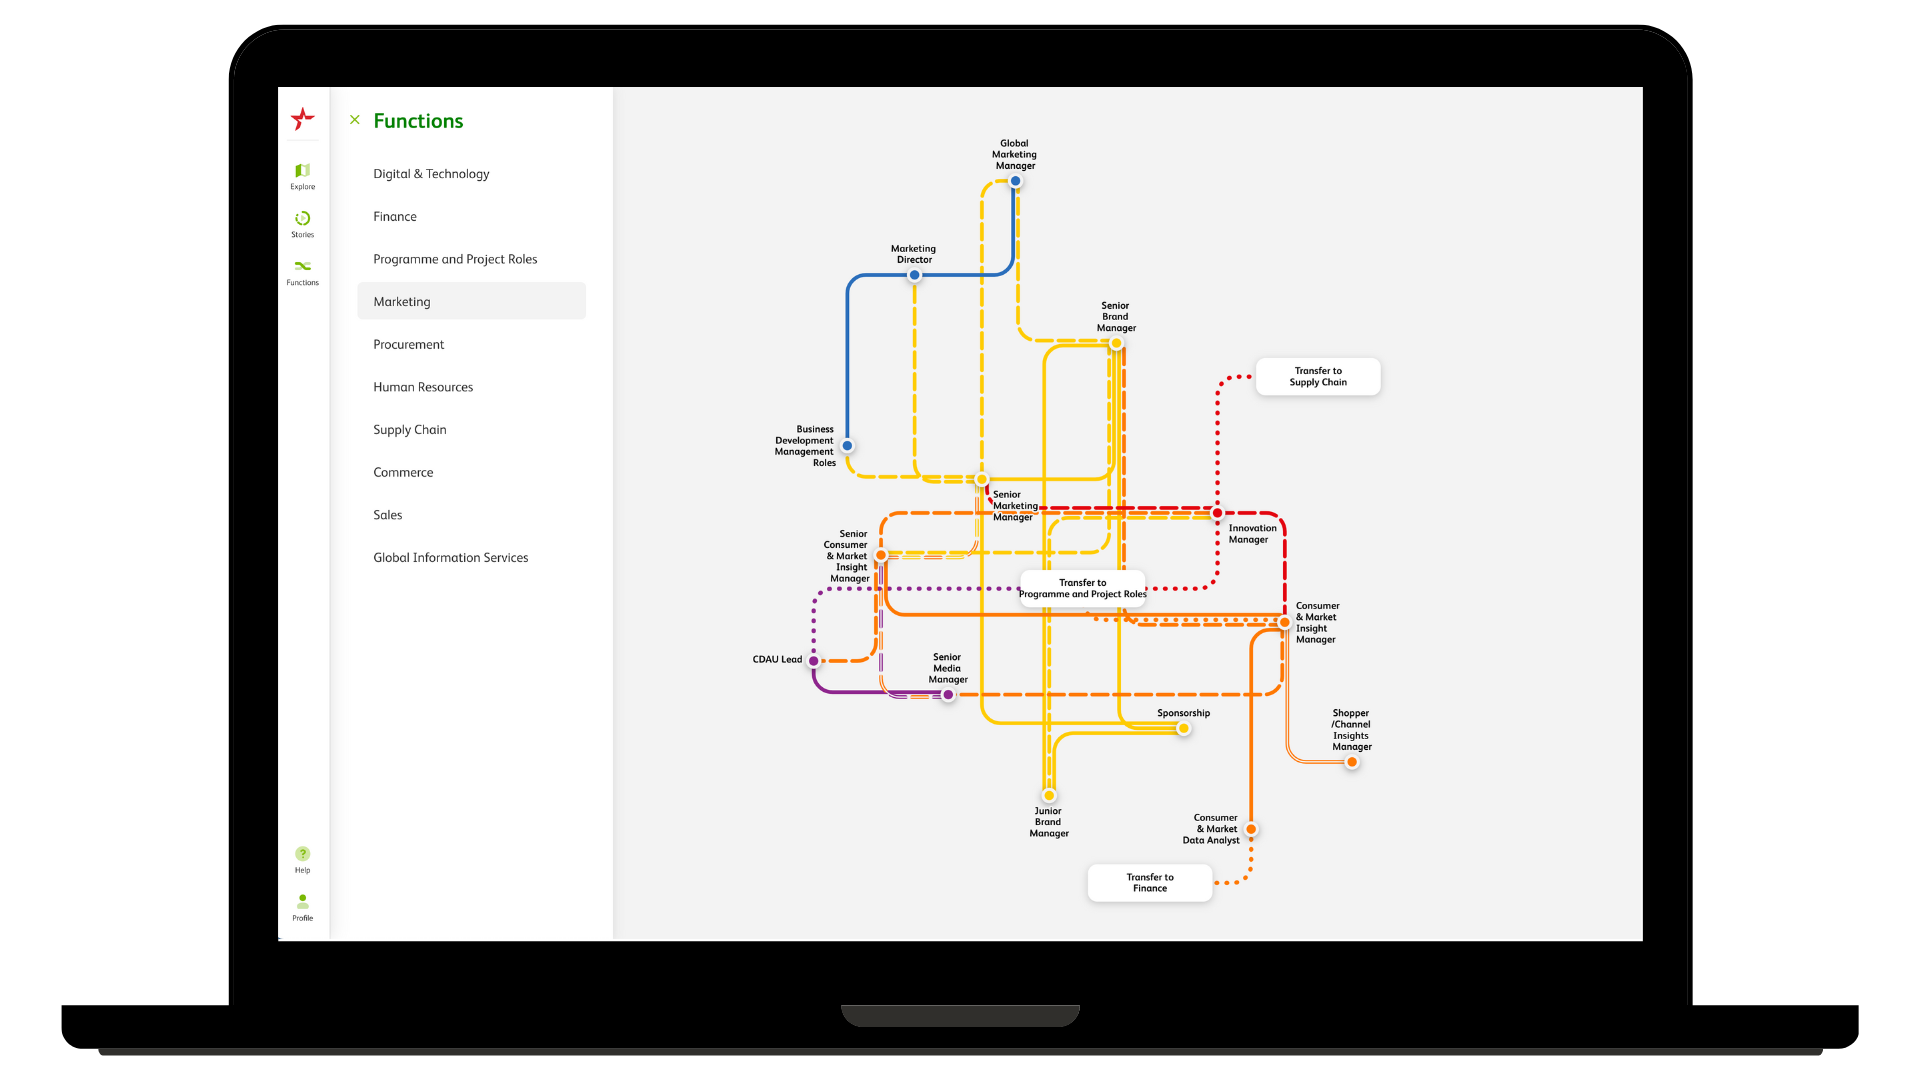
Heineken - Insight in career opportunities
Heineken employees wanted more insight into their career paths. Using The Career "Subway" Map - an interactive application - we provide employees worldwide with insight into the endless career opportunities at Heineken. Connections are made between roles, showing potential paths for growth. Clicking on a role reveals the necessary skills required. For this project, we collaborated with designers from Hike One.
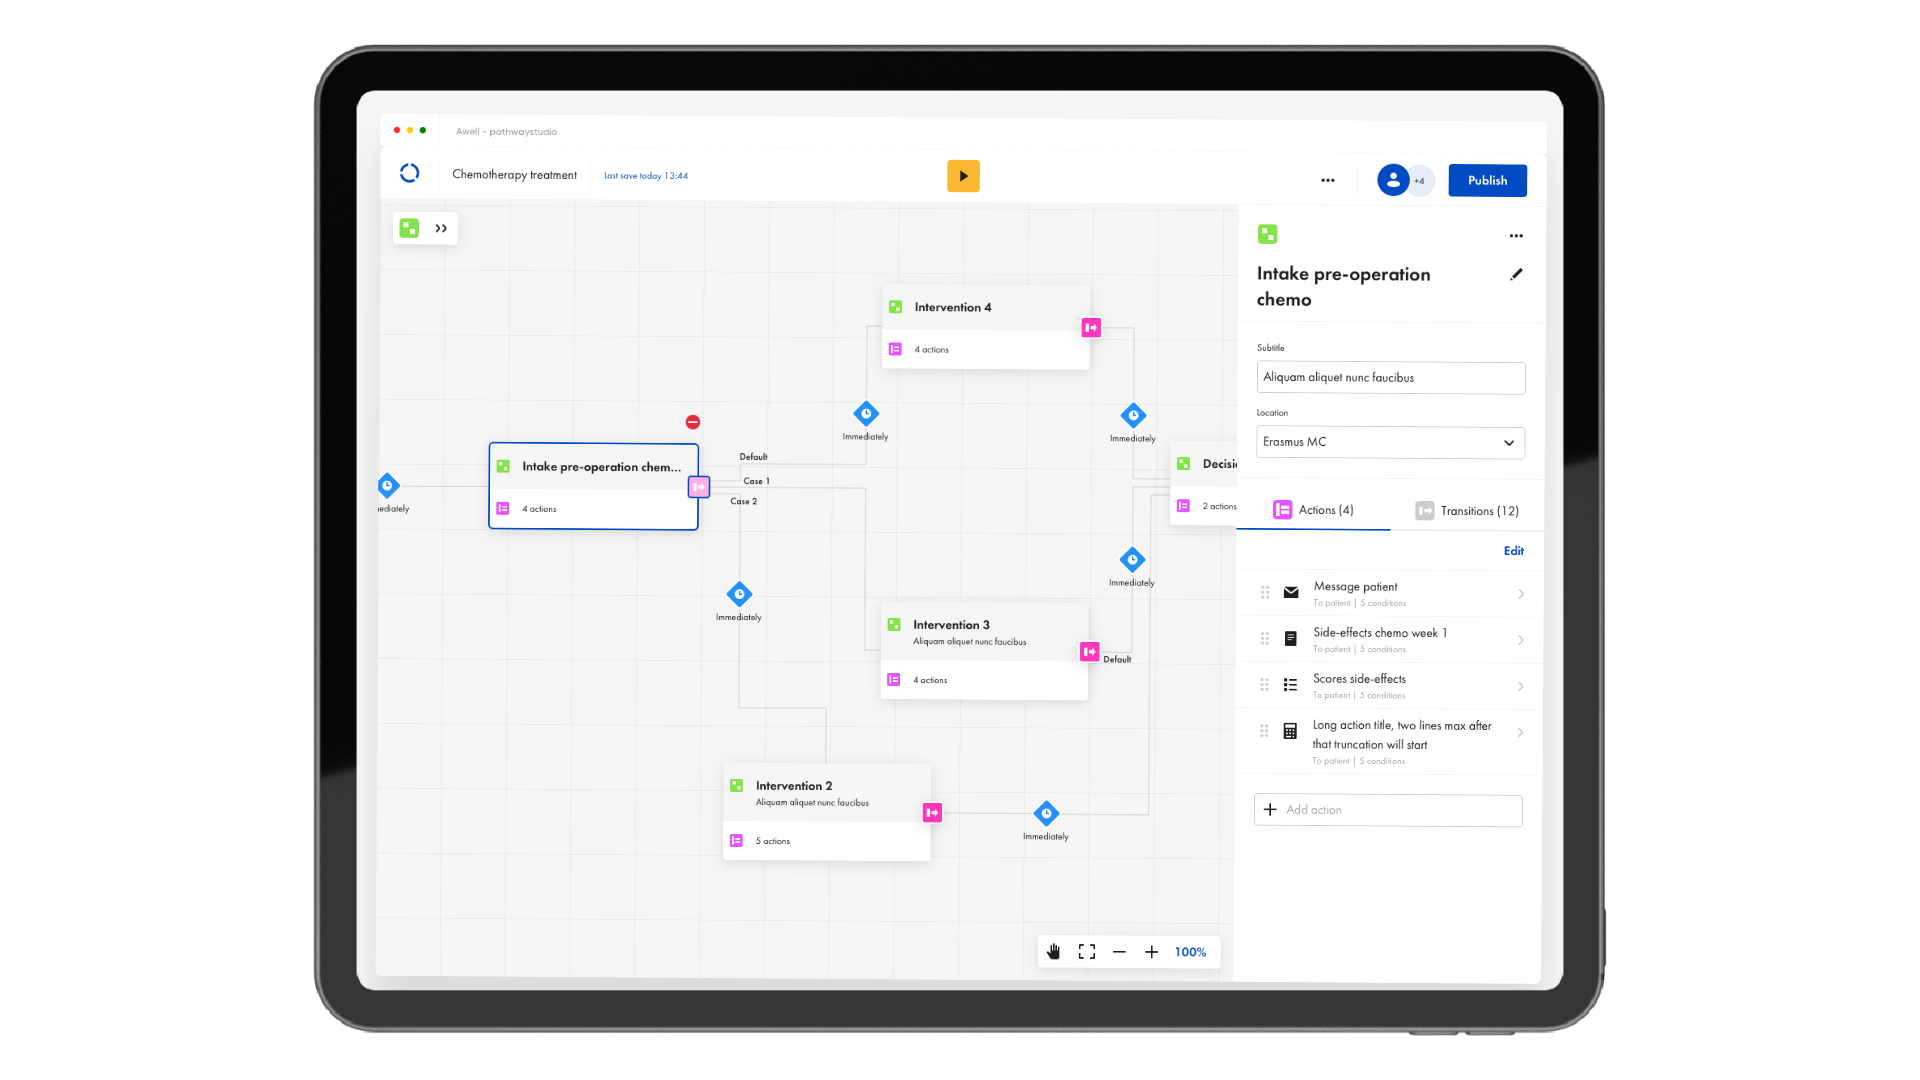
Awell Health - Clear and Shareable Treatment Plan
Awell Health is an e-health platform that helps healthcare providers digitise, integrate, and share patient-specific treatments and care pathways. It streamlines how hospitals, departments, and teams align responsibilities and protocols, while seamlessly monitoring progress and documenting results to create an essential environment for efficient healthcare decisions.
With a growing customer base, Awell Health took the opportunity to iterate on their first proof of concept. Together with Hike One, we developed an enhanced version of Pathway Studio. In a short period, we delivered a platform that allows trajectory builders to easily prototype and program patient treatment plans.
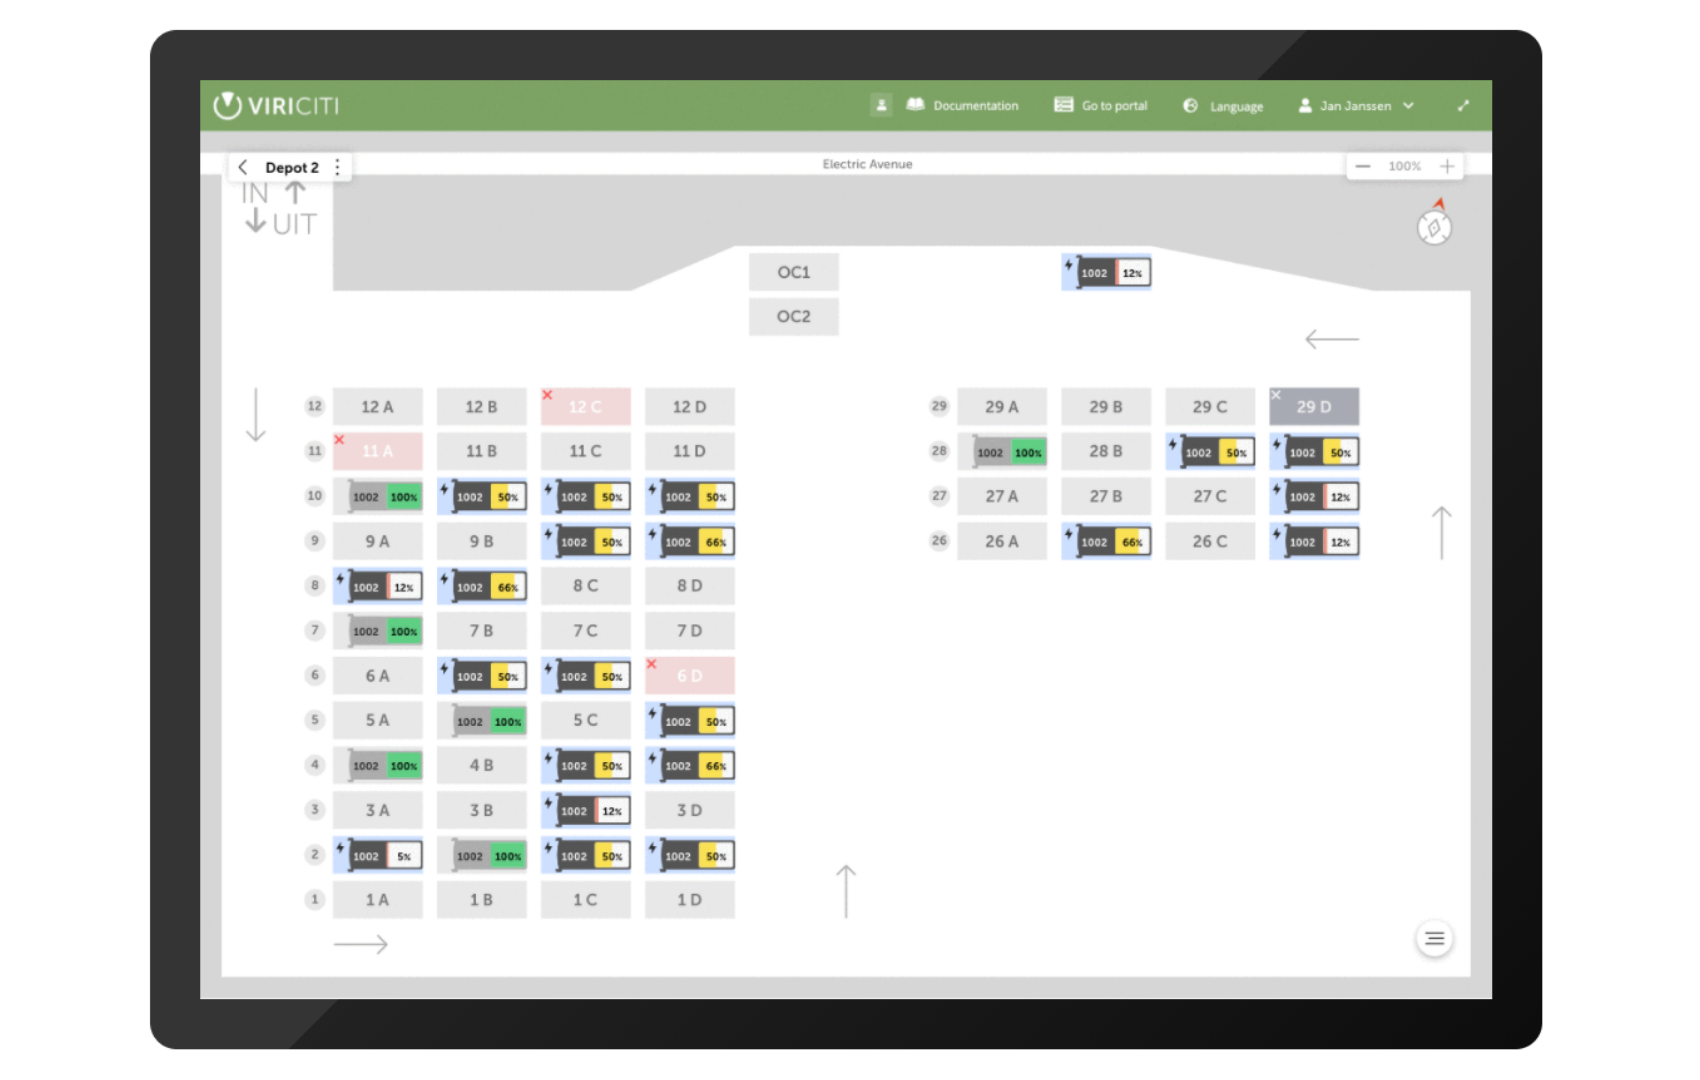
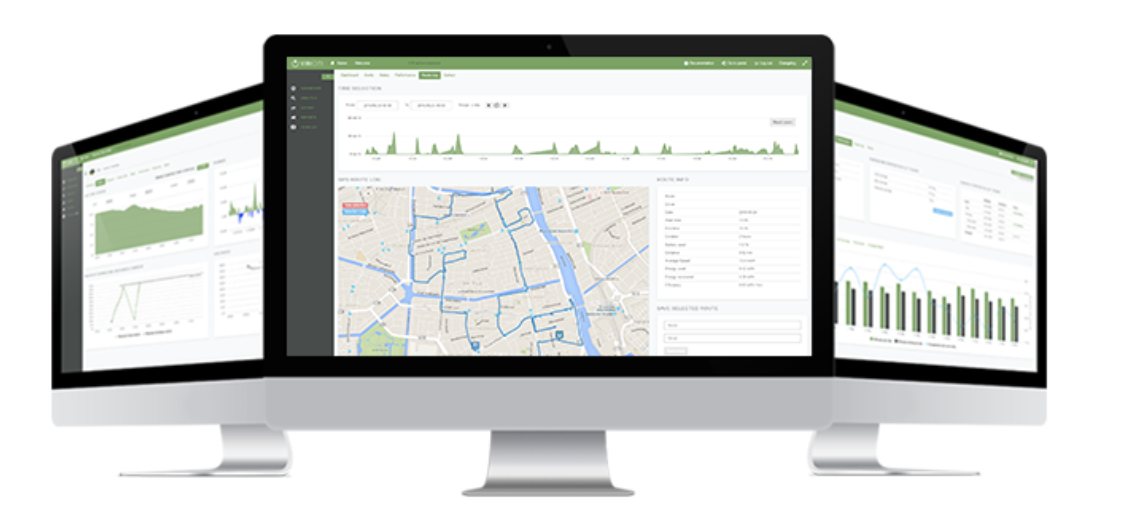
ViriCiti - Real-time dashboard for electrical busses
In collaboration with ViriCiti’s designers, we developed a real-time dashboard for electric buses. This dashboard, that we call Depot View, displays which buses are charging and which parking spots are available. The green colour indicates fully charged buses still occupying a parking spot. This enables more efficient allocation of drivers to specific buses and smarter routing of buses to parking spots. The overview easily identifies issues such as faulty chargers or a bus with low charge status. Additionally, it provides information on the estimated time for the vehicle to be fully charged. Information about the number of vehicles parked at the depot, regardless of fuel type, is also available.
Examples of interactive maps
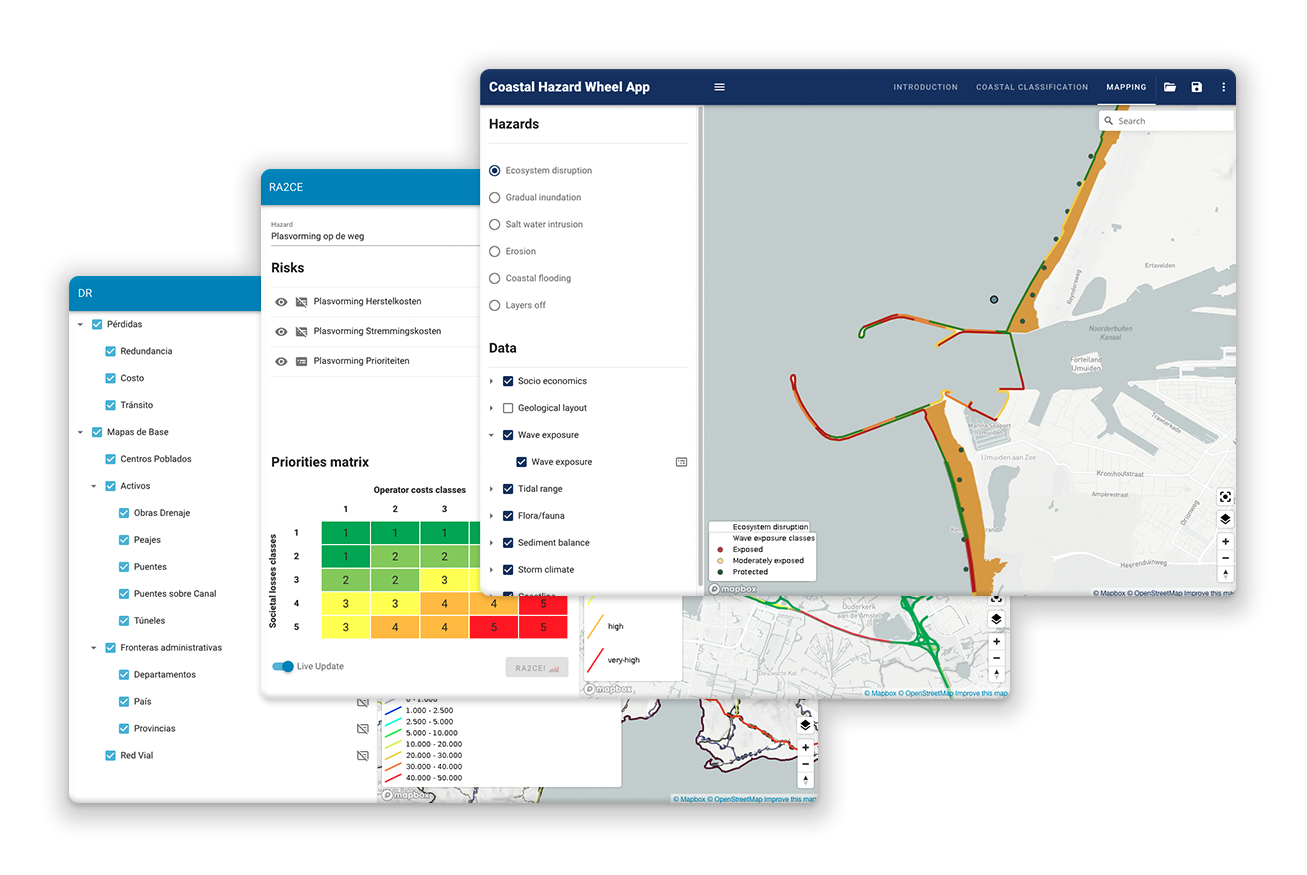
Deltares - Mapping Water Management
To simplify water management for Deltares, we developed multiple interactive maps that visualise data. Our technical approach was integrated with new scientific models to ensure the application's functionality. This resulted in projects such as the Adaptation Support Tool used by urban planners to create sustainable urban environments. Another project is the Kitchen Table Tool, designed for farmers and water authorities to collaboratively determine effective measures for water quality improvement.
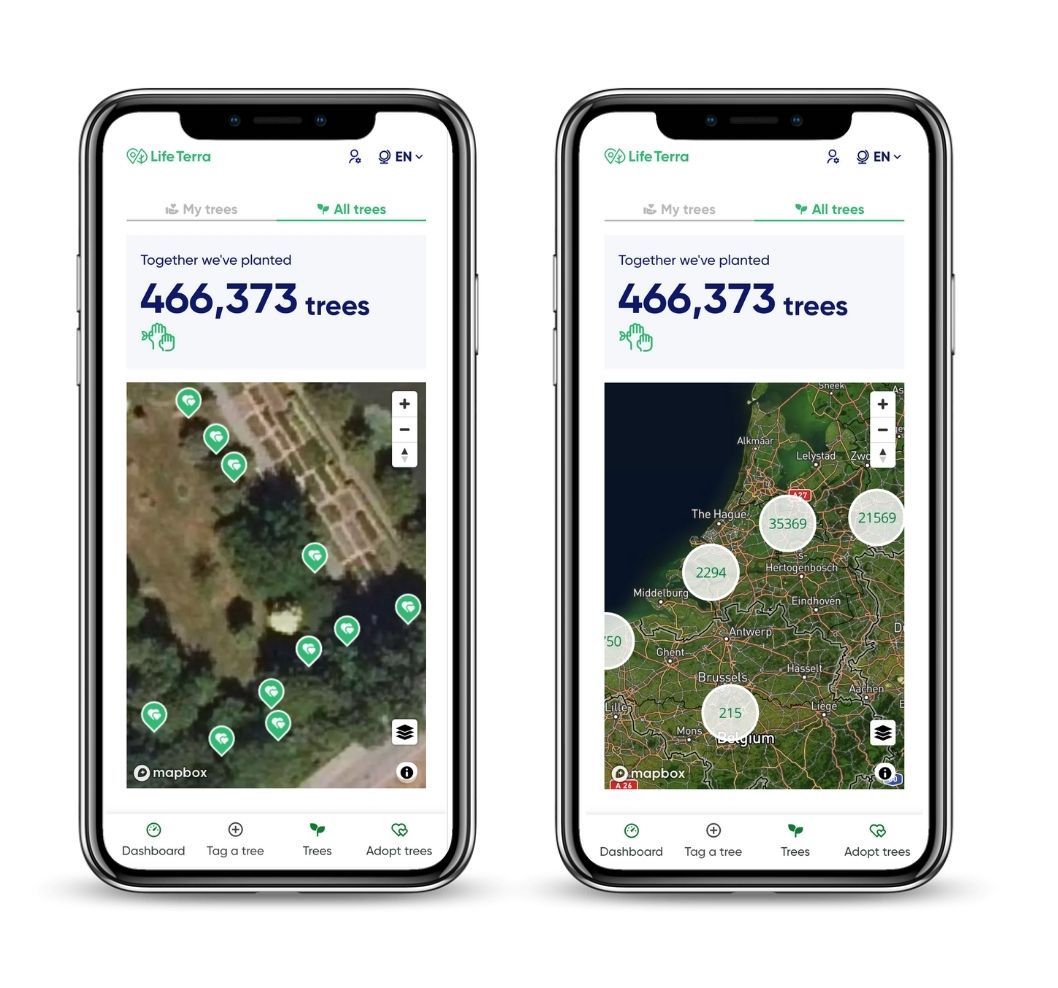
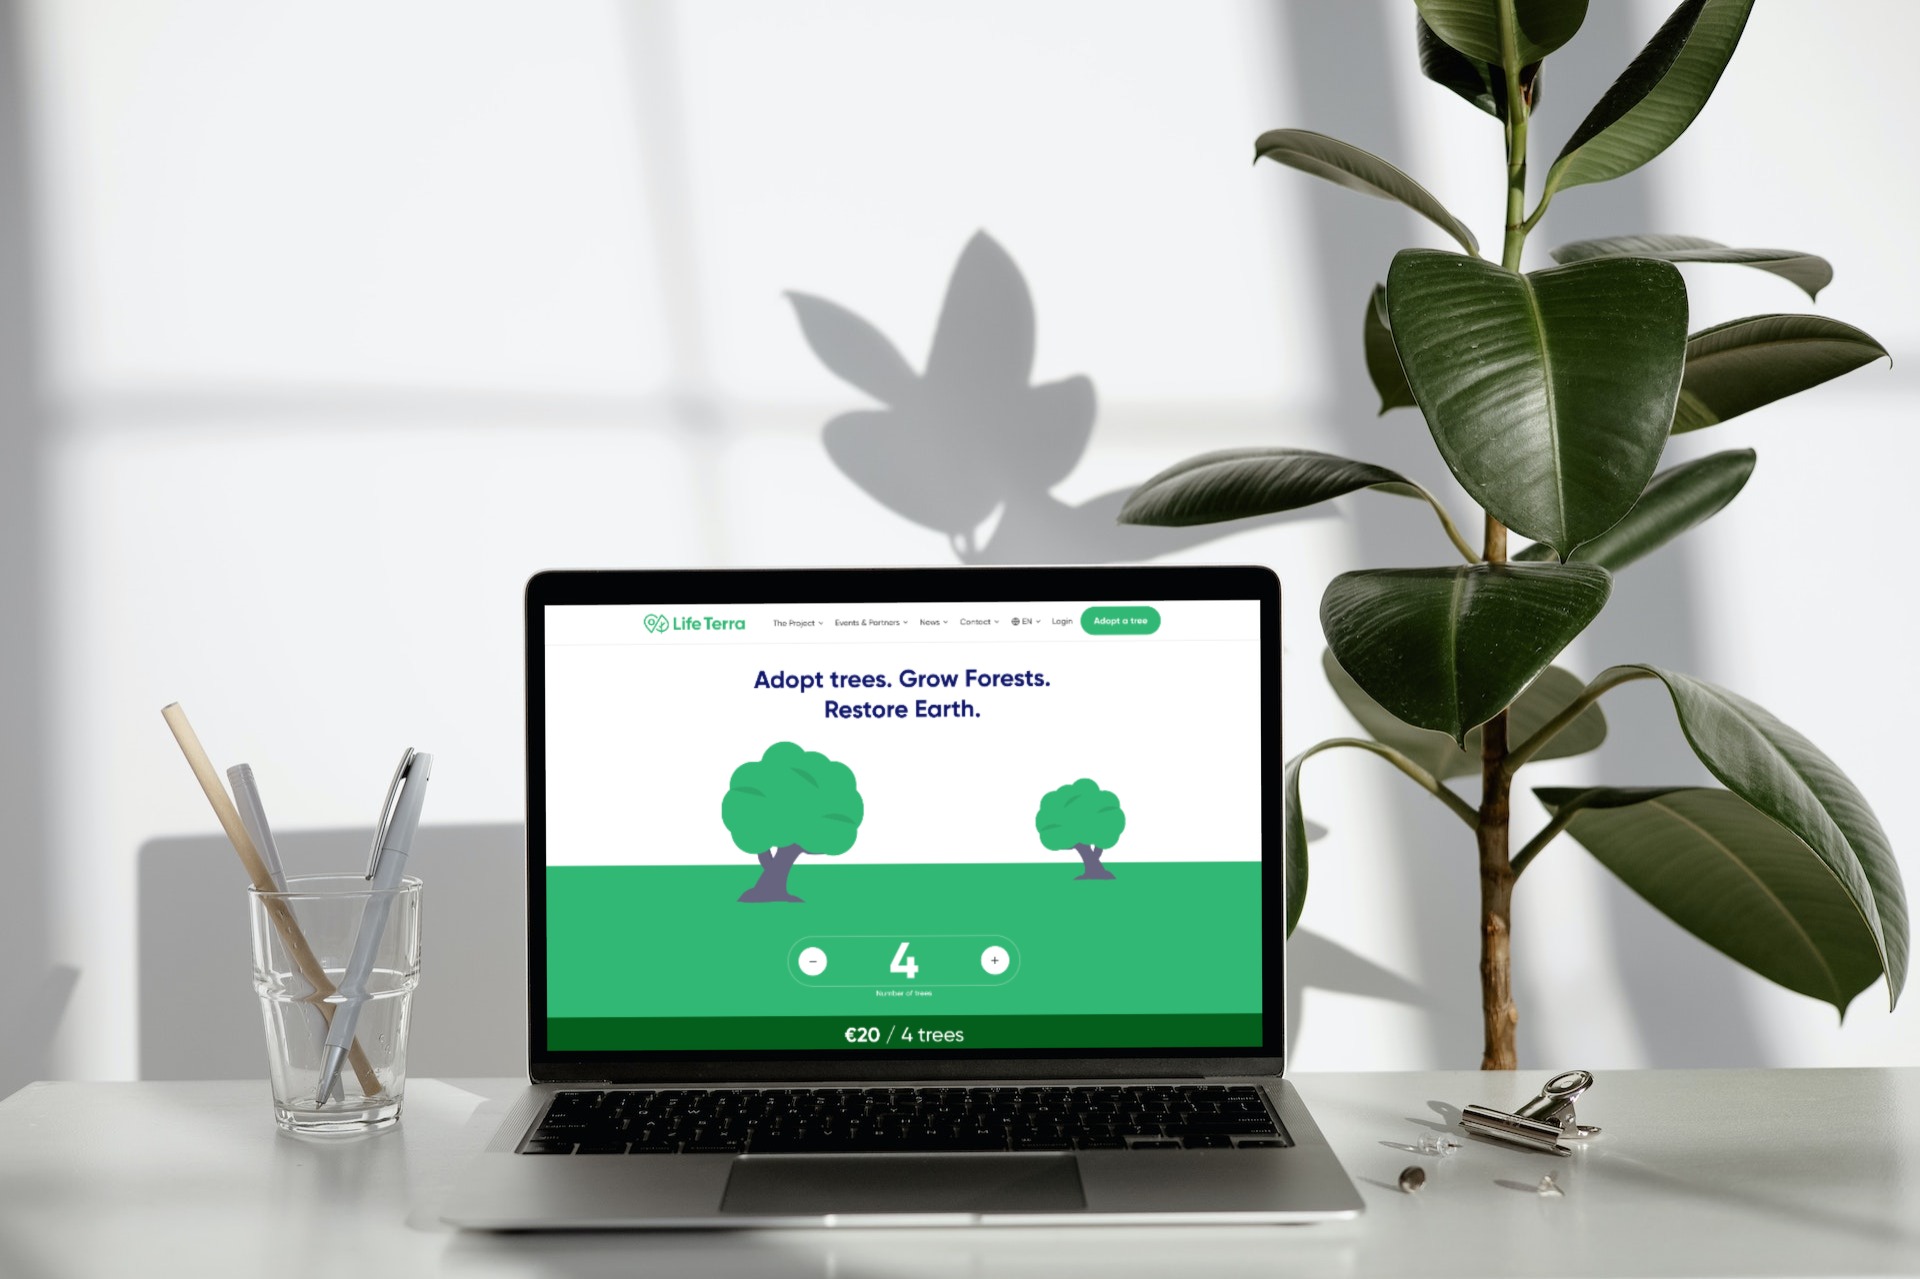
Life Terra - Interactive Map with Adopted Trees
For Life Terra, we developed an interactive map displaying adopted trees across Europe. Each tree provides details about its species, location, planting date, and a photo. The map remains clear even with thousands of trees in the same location. When zooming out, smart clusters appear. Zooming in reveals individual trees at specific locations.
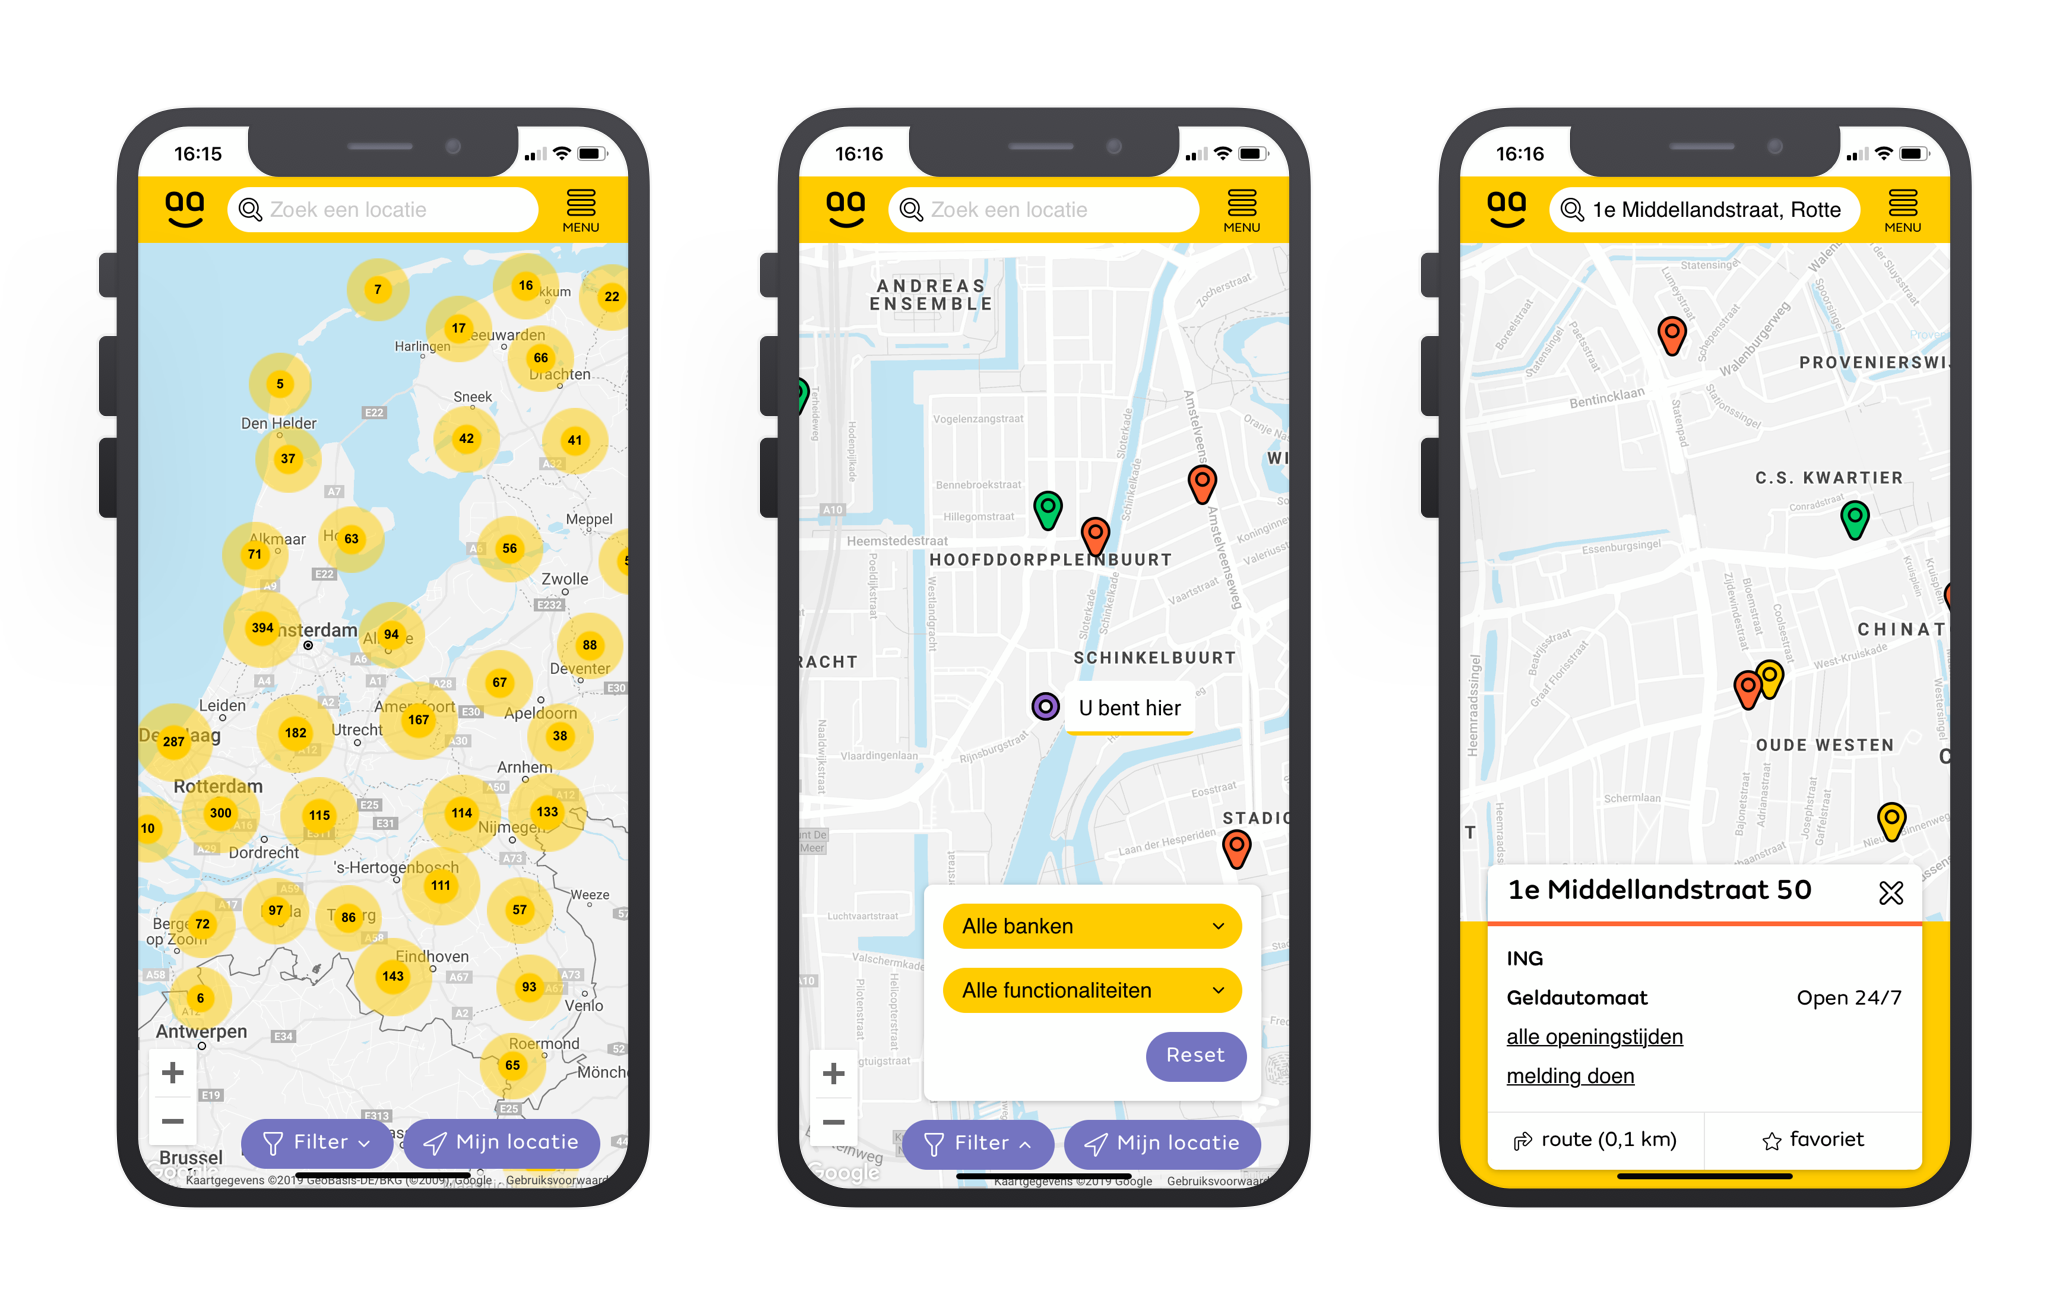
Geldmaat - ATM Location Finder
We created an interactive location finder for Geldmaat, allowing users to locate the nearest ATM. Together with Schuberg Philis, we developed a real-time API that provides information about ATMs to users of the location finder. The API is also used by software developers and monitoring systems within Geldmaat.
Want to visualise your data just like Geldmaat, Heineken and Deltares? Contact us!
We're here to assist with your data visualisation project. Contact Jasper to schedule a meeting.
Want to know more about De Voorhoede, our approach, and rates? Have a look at the FAQ.