
Memory leaks are common in Single Page Apps. How do you find and fix them?
Last week we're challenged with the question to look into a possible memory leak in one of our projects. Hunting down the leak gave us some insights that we want to share with you!
Step 1: Reproduce
First we have to determine that there is in fact a memory leak. We just got complaints from our client that users reported sluggishness in the UI and crashing browsers after using the web app for a while.
In our web application after initial page load all routing is done client side as we use Nuxt.js. The complaints combined with client side routing gave us the impression that it could be a memory leak.
Let's test if our assumption is right:
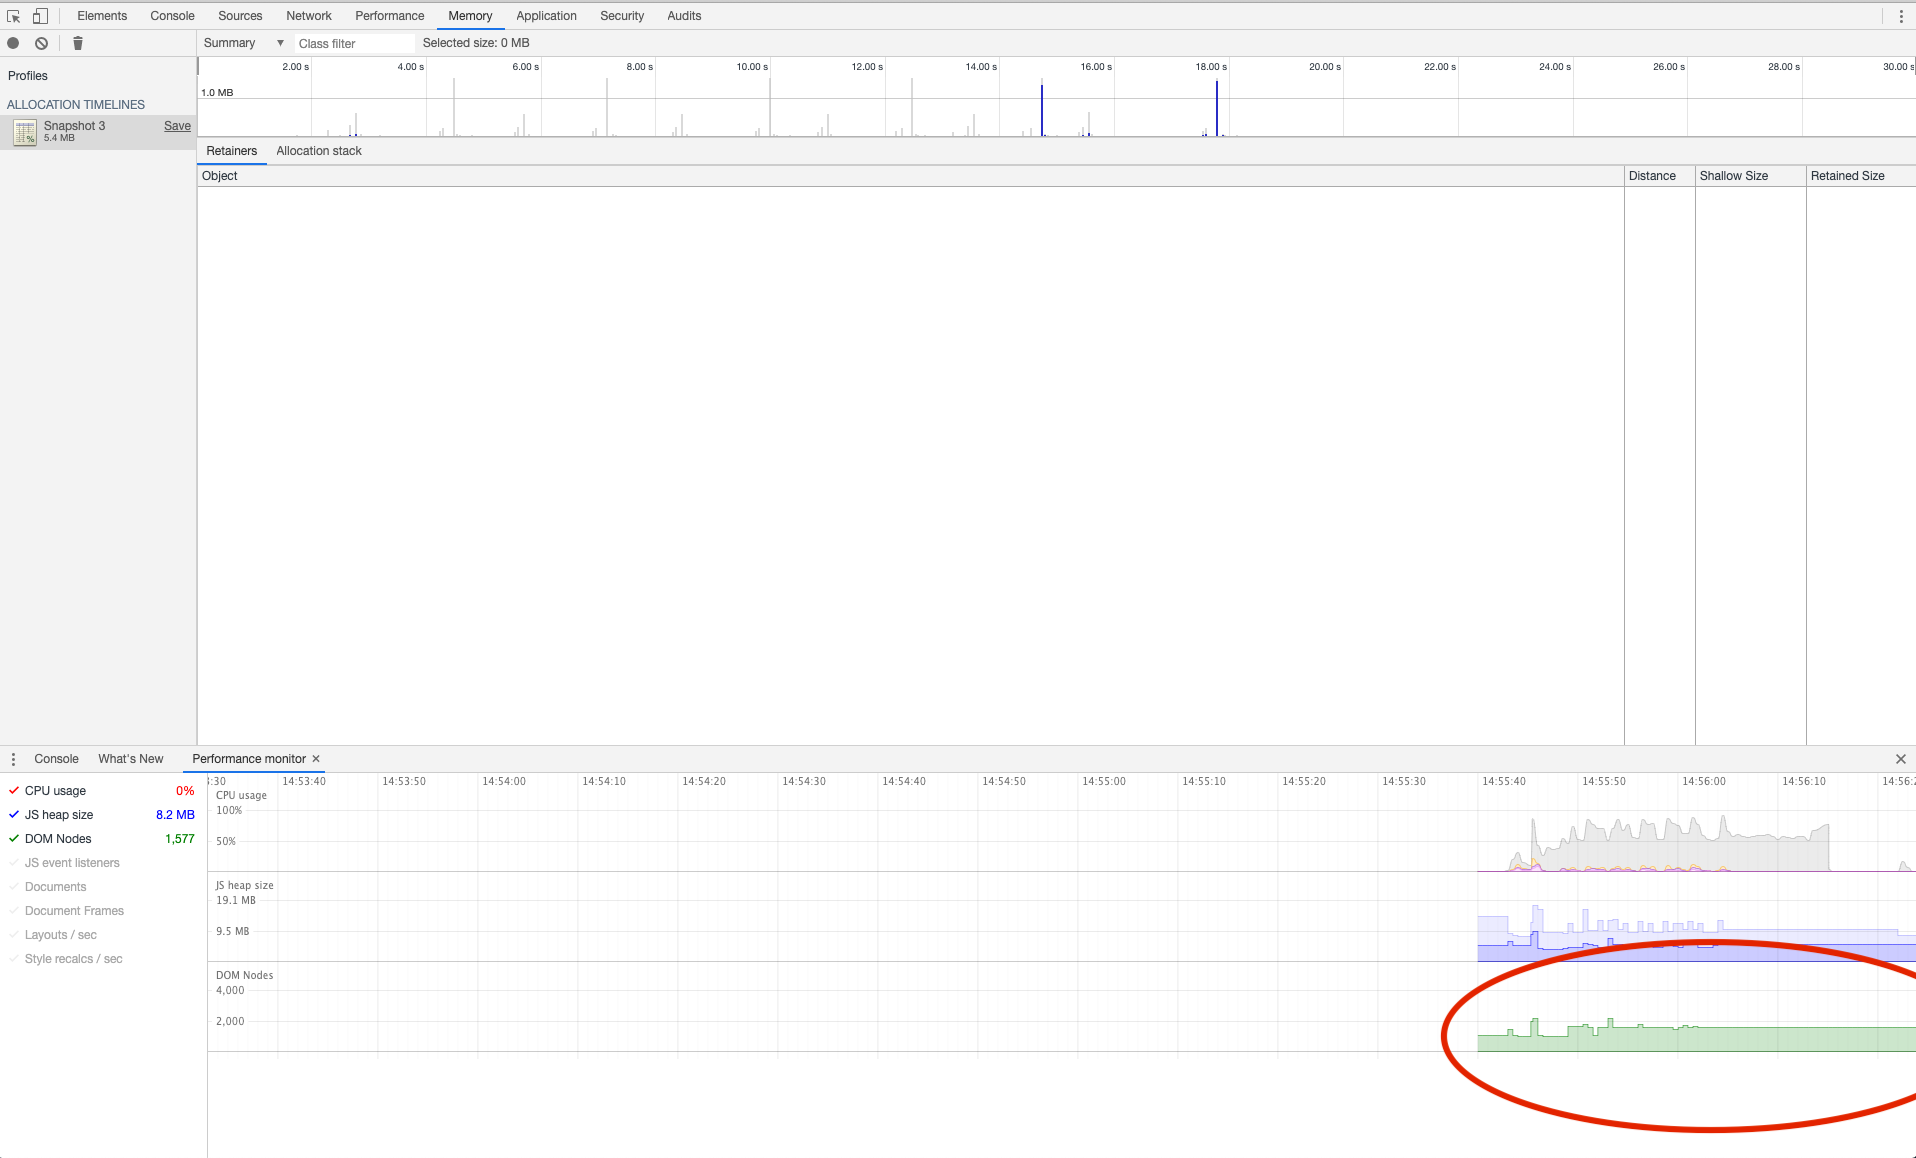
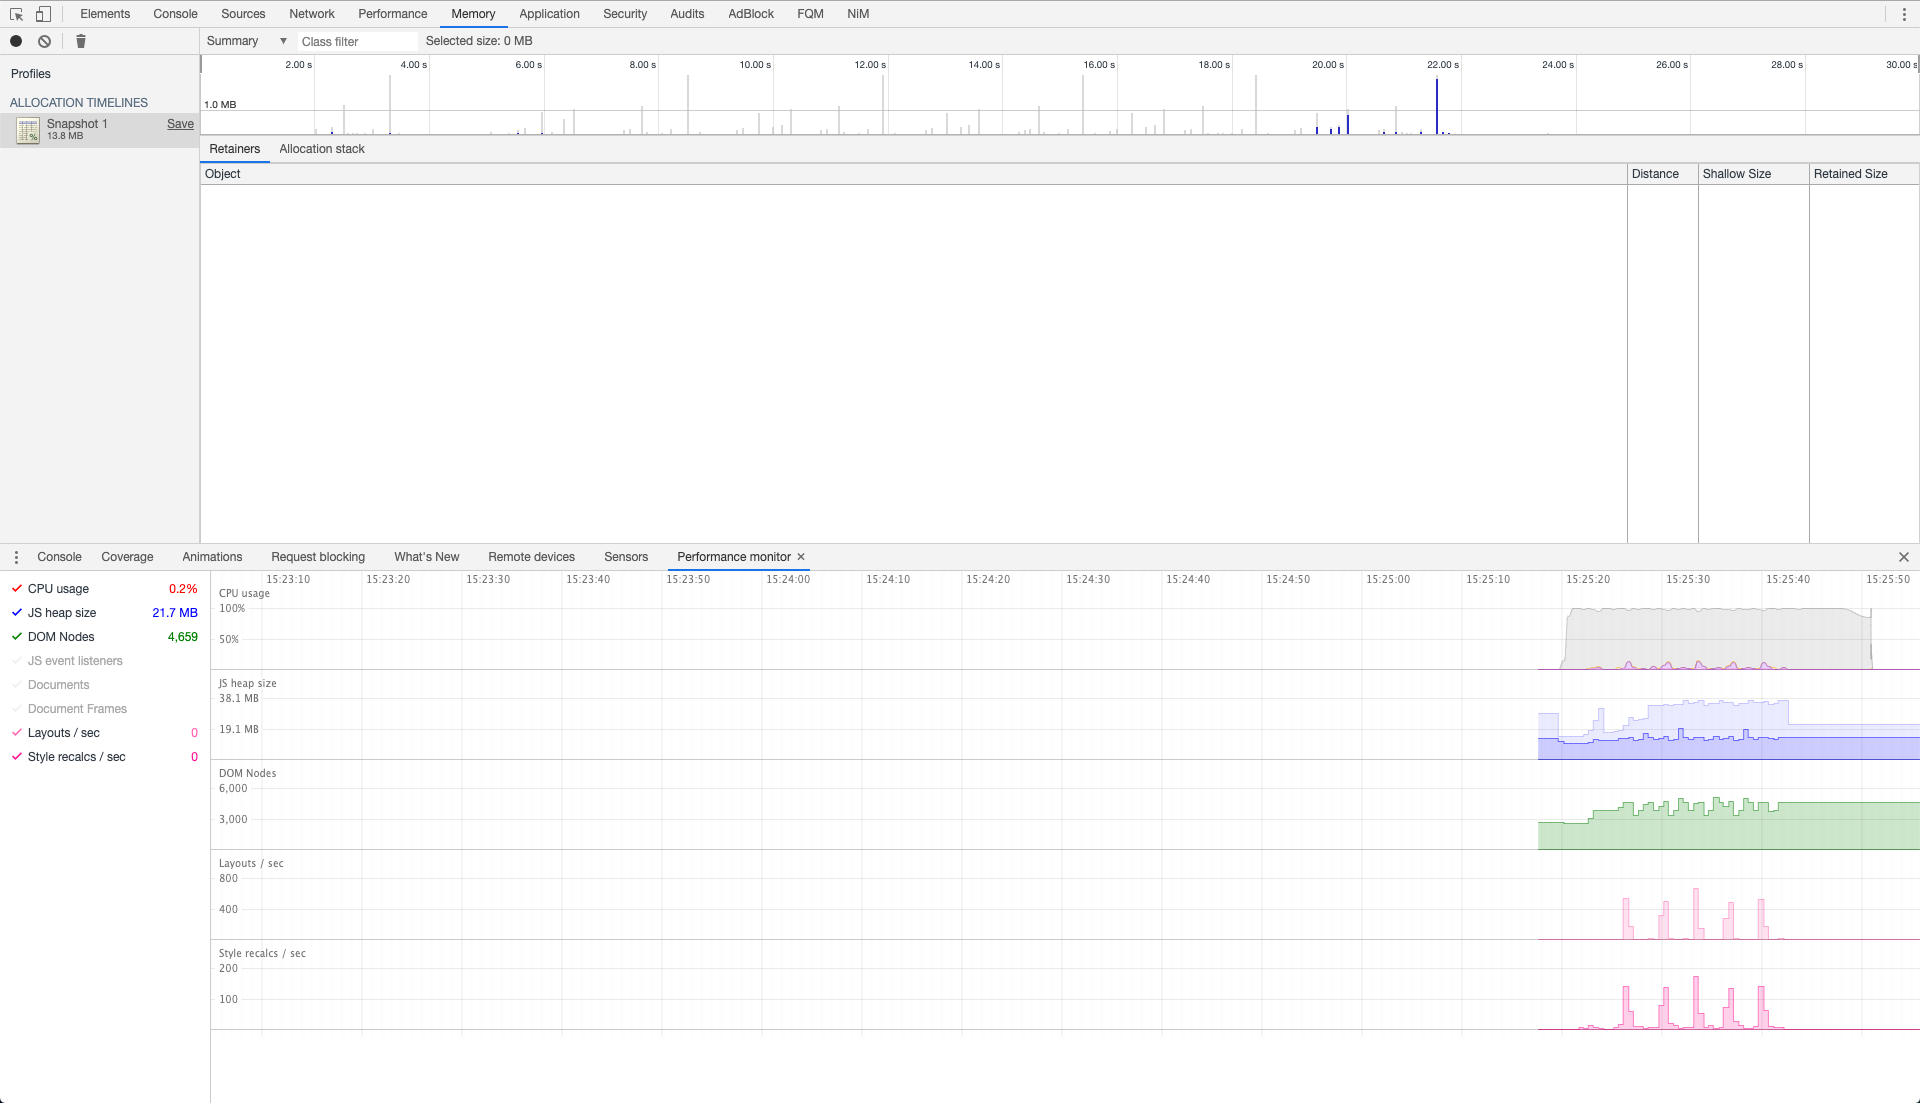
The most common route taken in our web app is navigating from an overview page to a product detail page and back. When we repeat these action 6 times with performance monitoring tools open it provides insights on memory usage:

Analysis shows that the number of DOM nodes keeps growing. DOM nodes represent the visual elements on a page and can therefore consume quite some memory. Normally these would be garbage collected when there are no references to these nodes anymore. Ideally when these DOM nodes are removed from the DOM. This is not the situation. The numbers just keep growing and growing until our page becomes unresponsive.
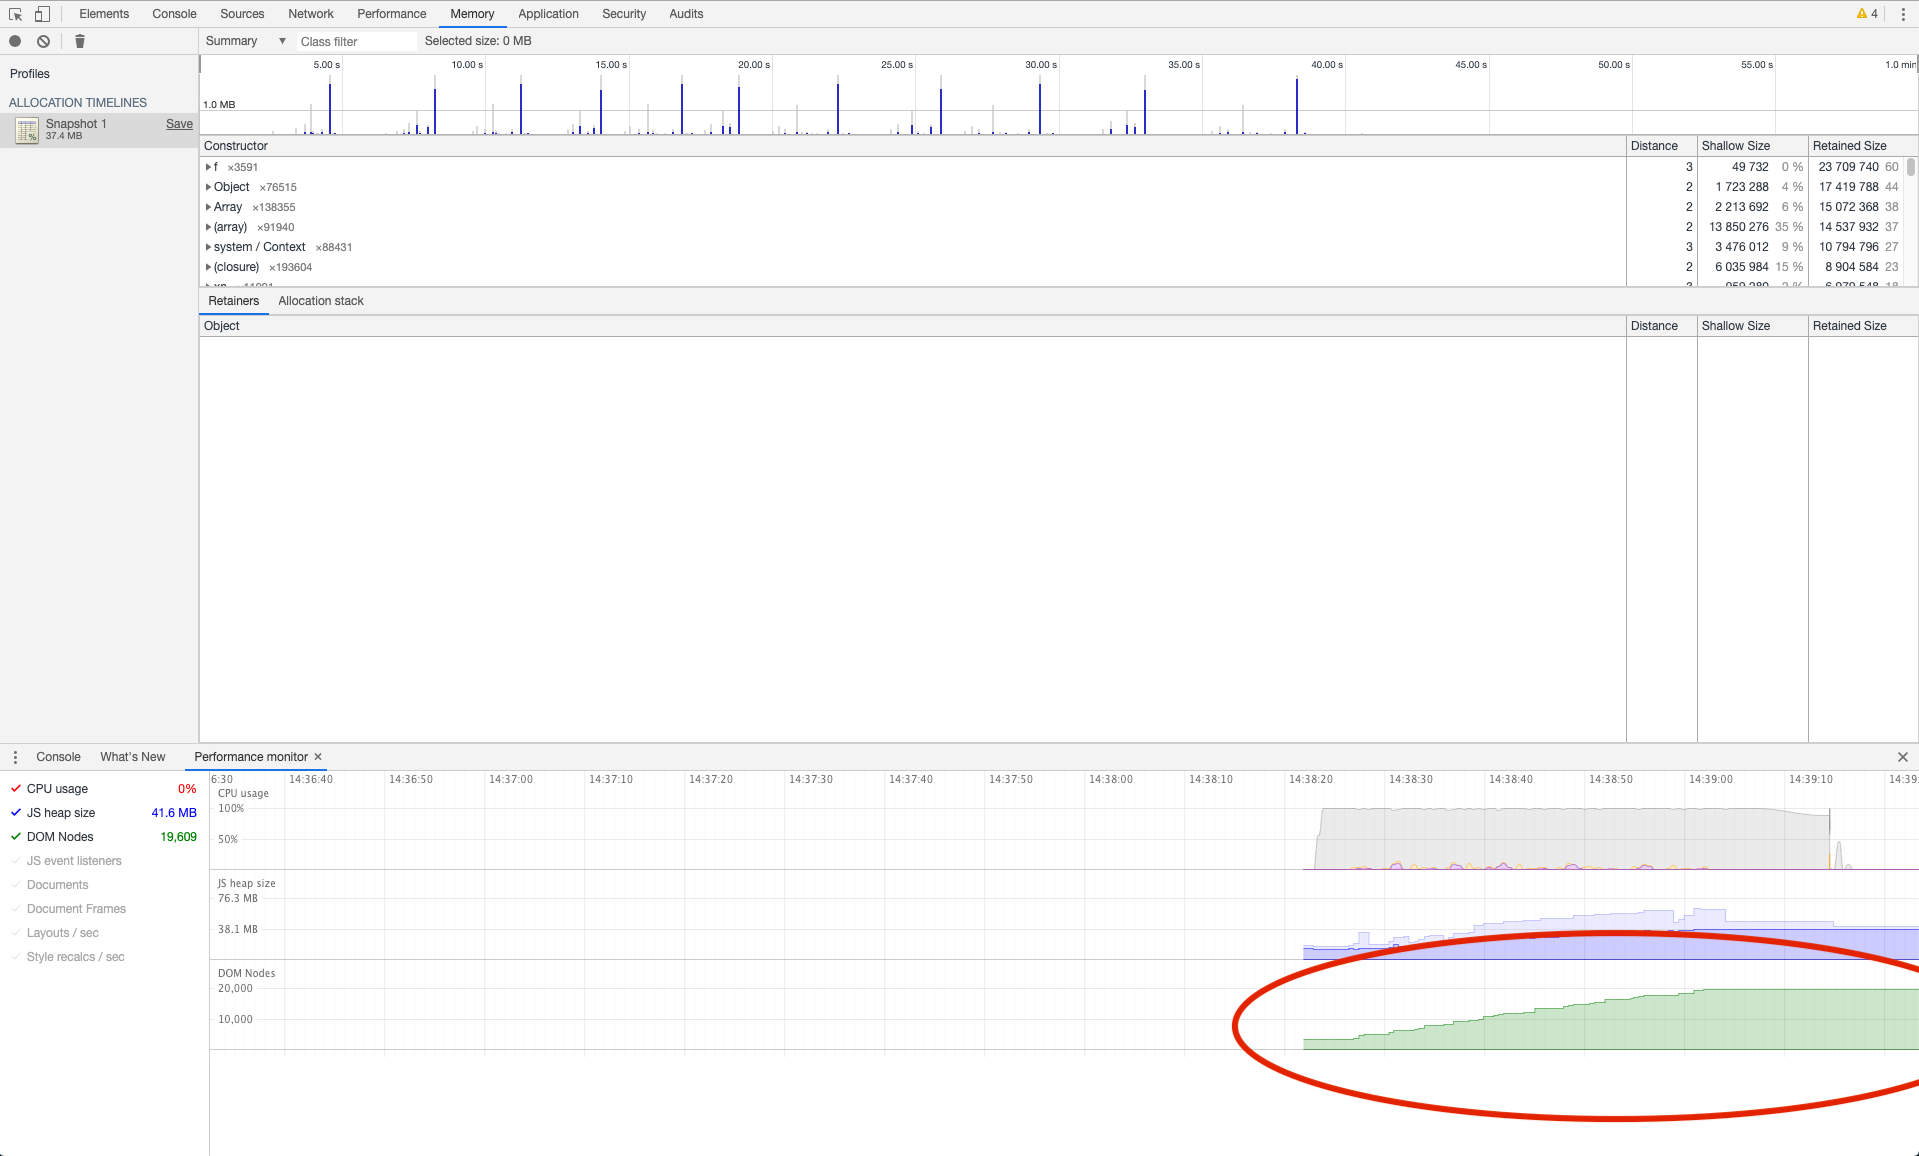
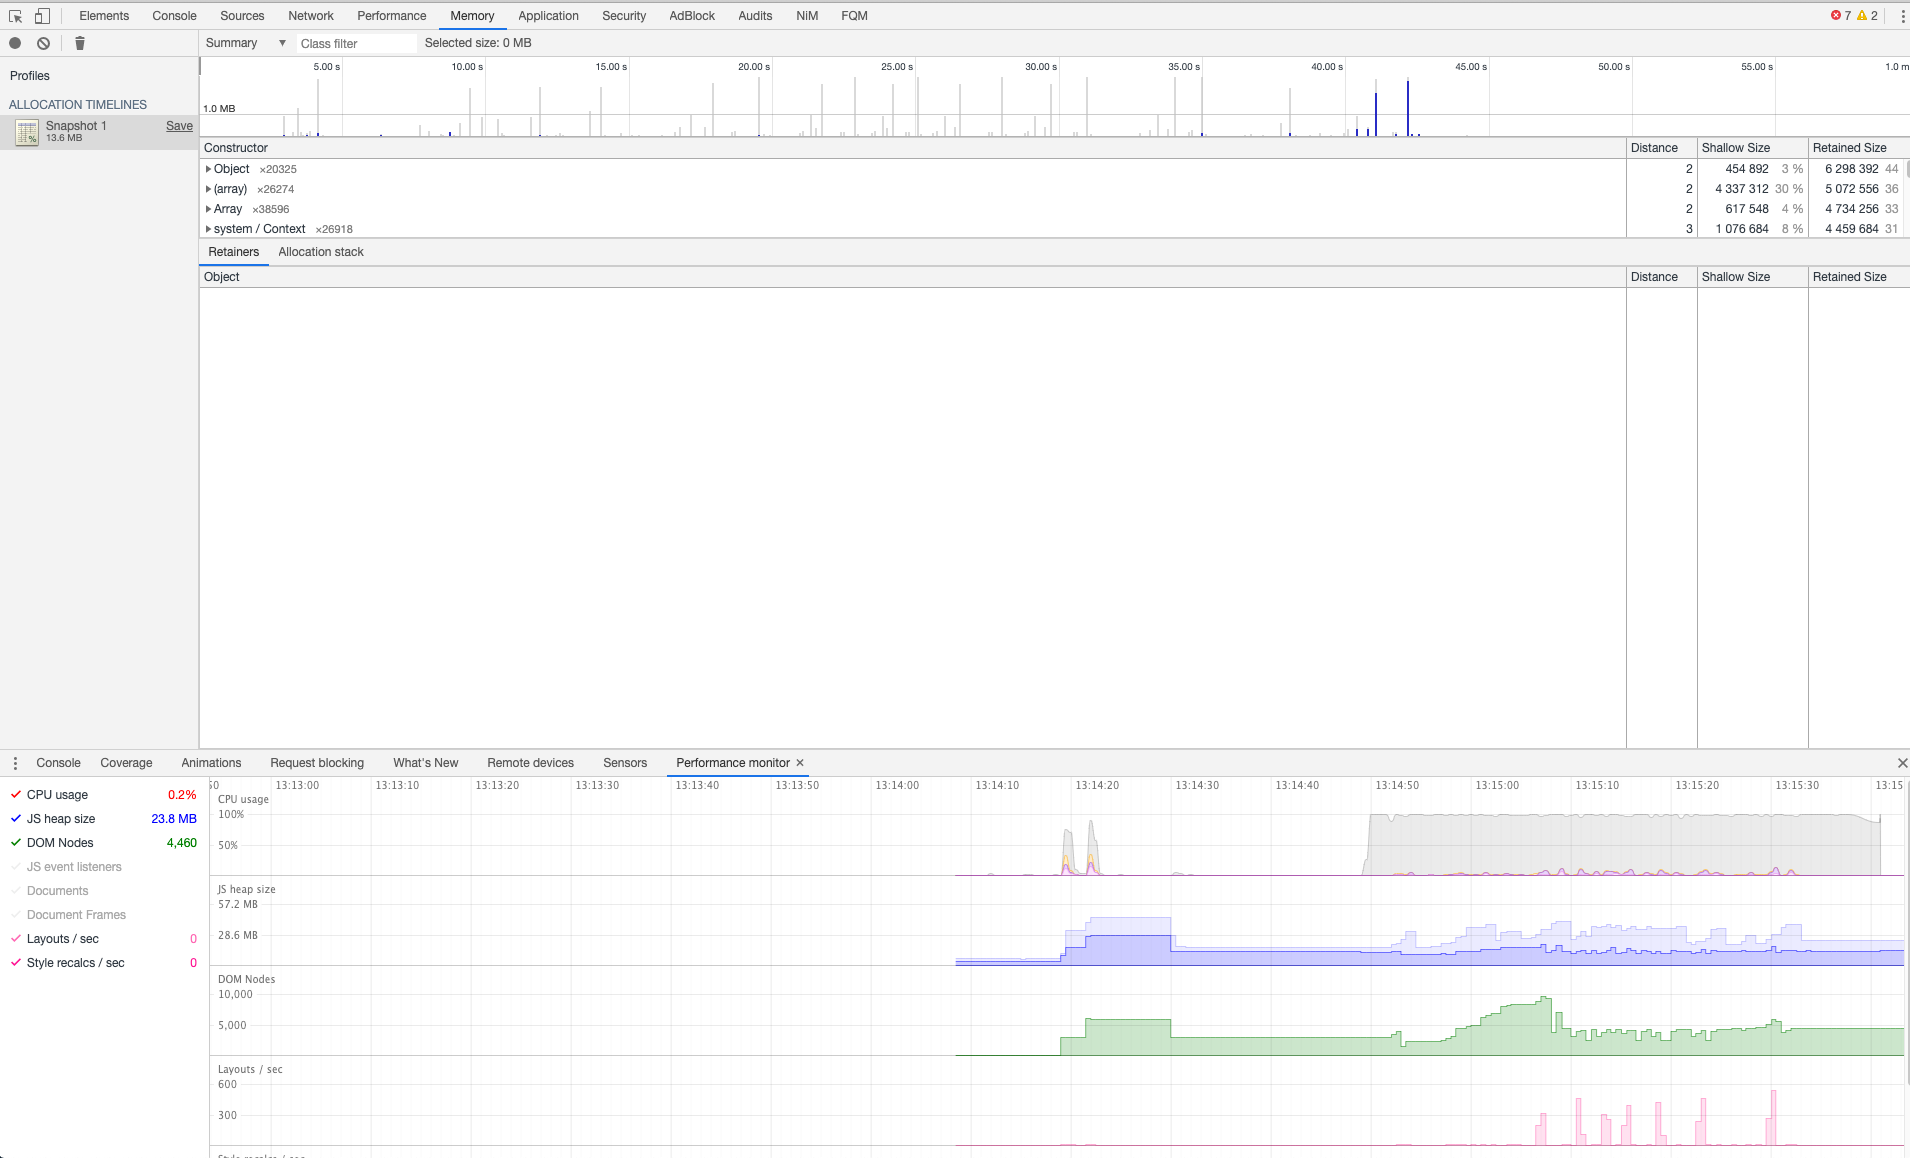
Below you see a “normal” situation where we navigate from a category like page to a detail page on a web application where garbage collection does occur. Note the huge difference in number of DOM nodes and Javascript heap size.
Step 2: Analyse
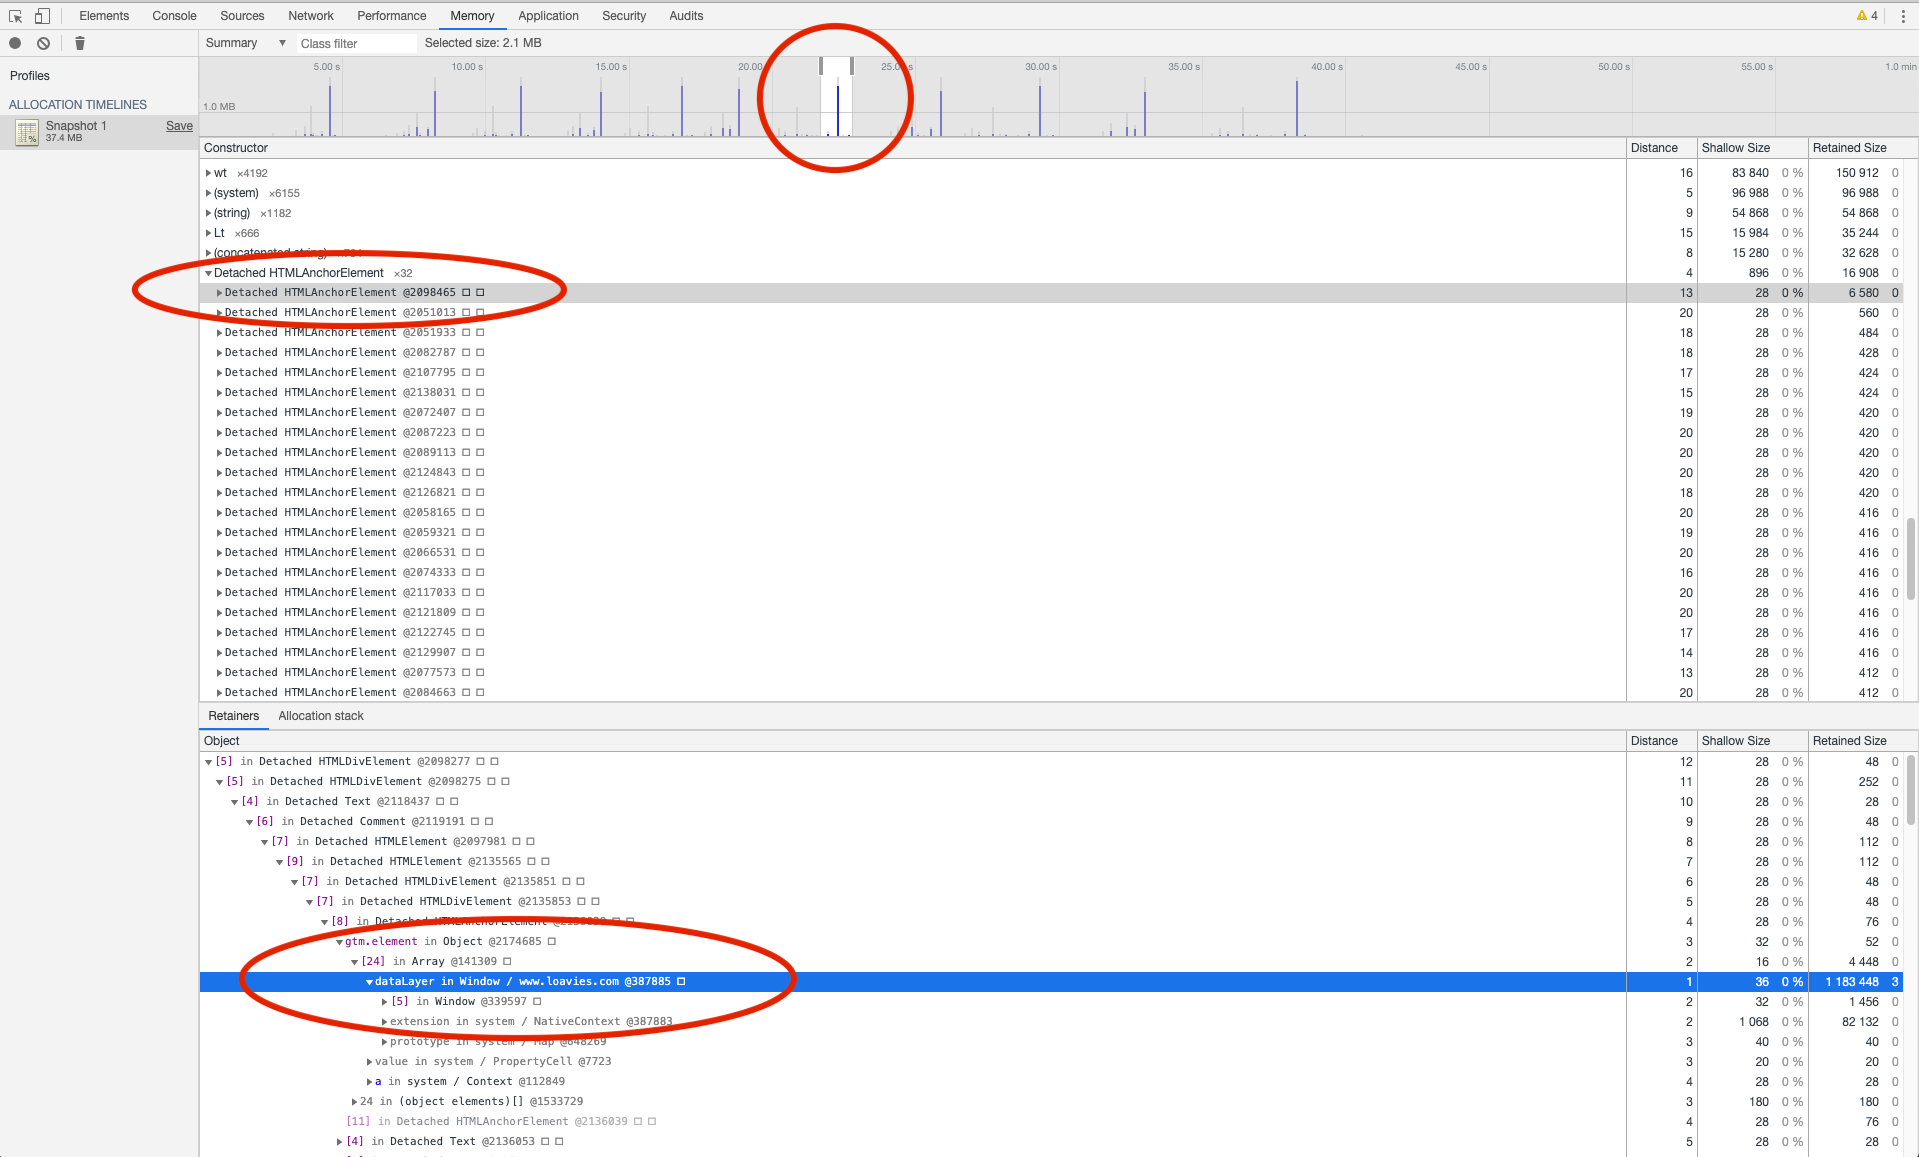
Step 2 is to drill down and find the culprit to the problem. We dive deeper into the timeline of memory allocations. In the visualisation of the timeline, grey spikes are memory allocations that are garbage collected, blue ones are still present. If you look into the image above, the one where garbage collection does occur, you will see the previous page and current page only having blue spikes and all previous page navigations became grey spikes. You want this sort of saw like pattern. See our test case below:
The above report shows that every page navigation leaves blue spikes behind, that never get garbage collected. Diving deeper by selecting only one page navigation, which happened some navigations ago, you will notice that there are a lot of detached nodes. These are DOM nodes that are no longer present in the page, but are still being referenced somewhere.
Diving even further into one of these detached nodes, we find that they are referenced in a dataLayer object, which comes from Google Tag Manager(GTM).
Step 3: Validate
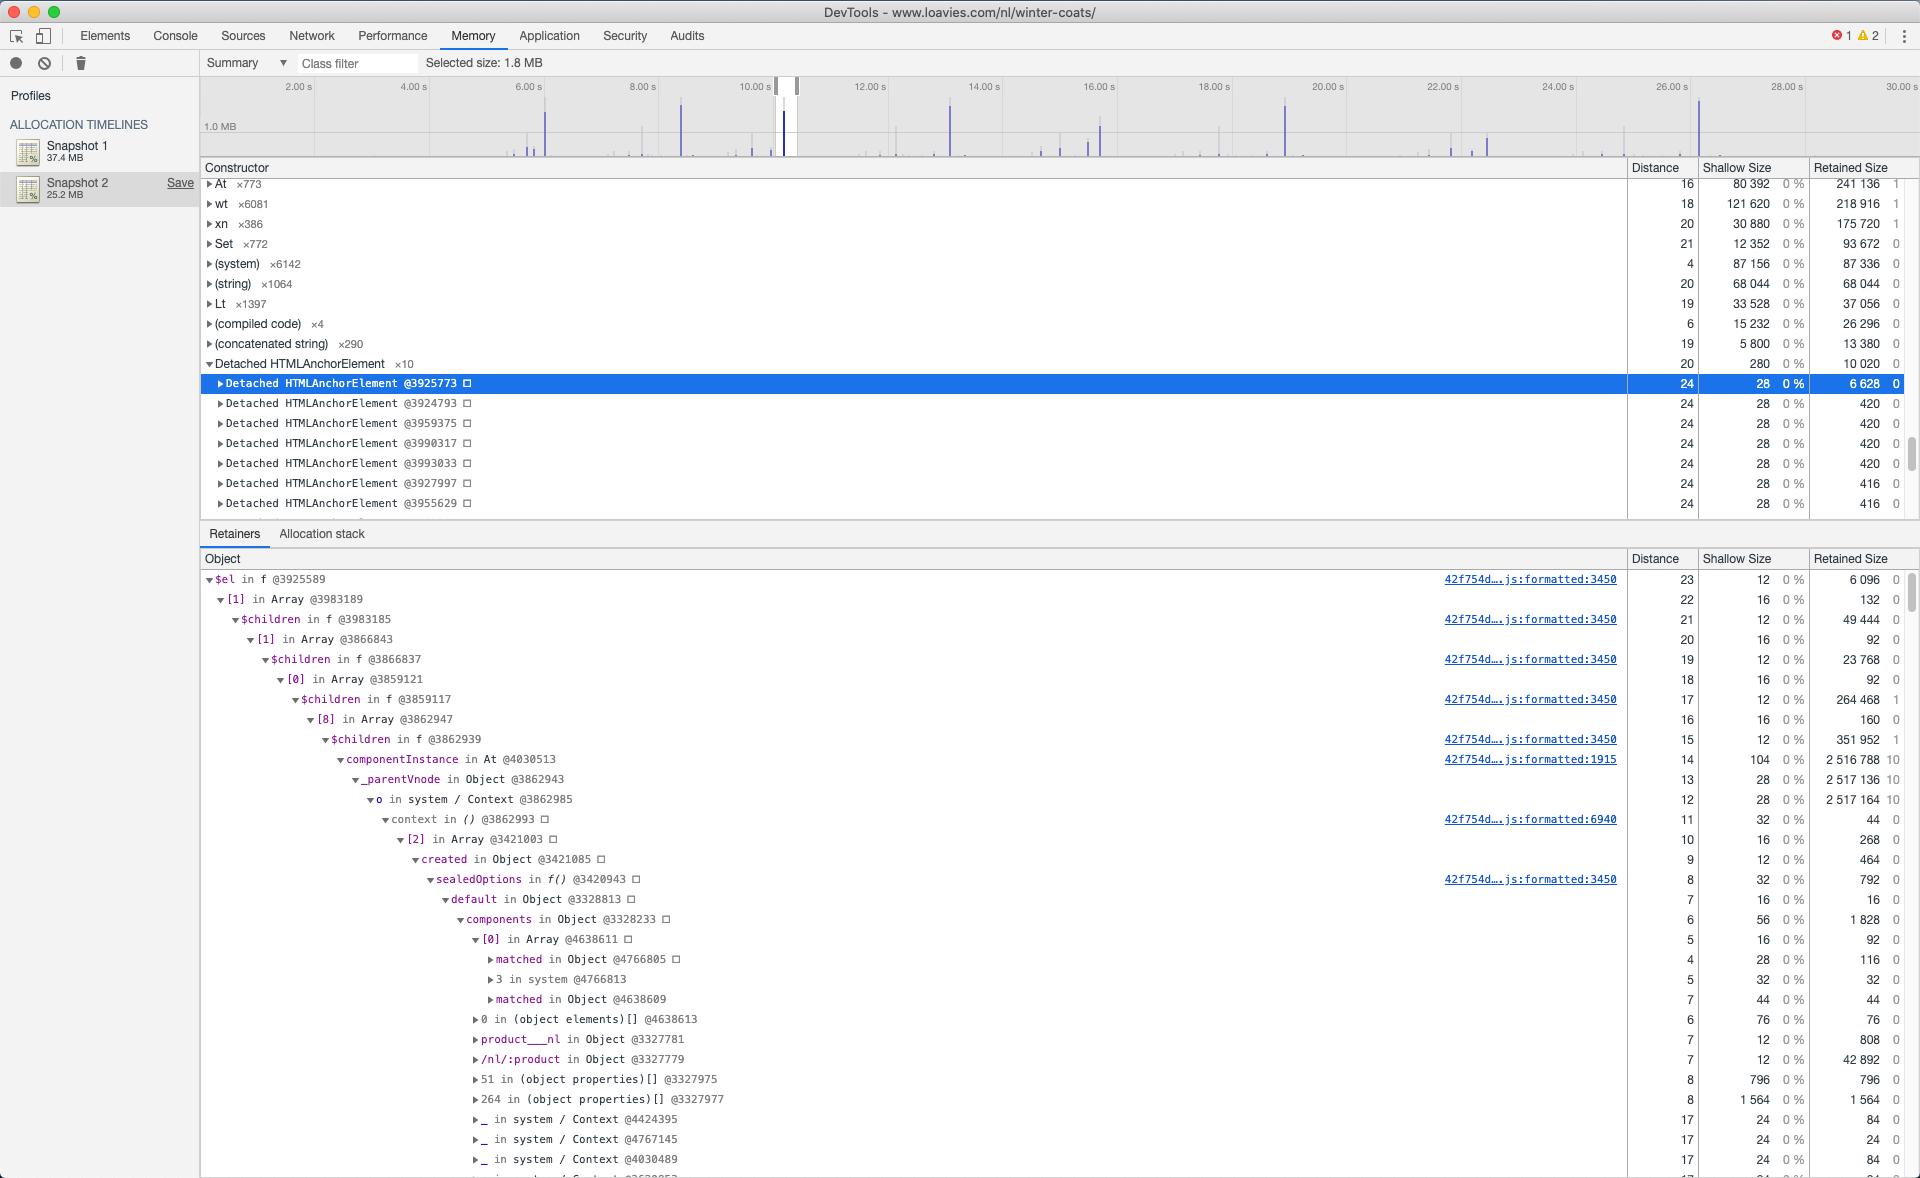
The next step is to remove GTM to see if the problem still occurs. Analysis of the situation after removing GTM shows that while the problem is less problematic, it still occurs. See below that we can identify more detached nodes.
Let's find the next issue.
Step 4: Iterate
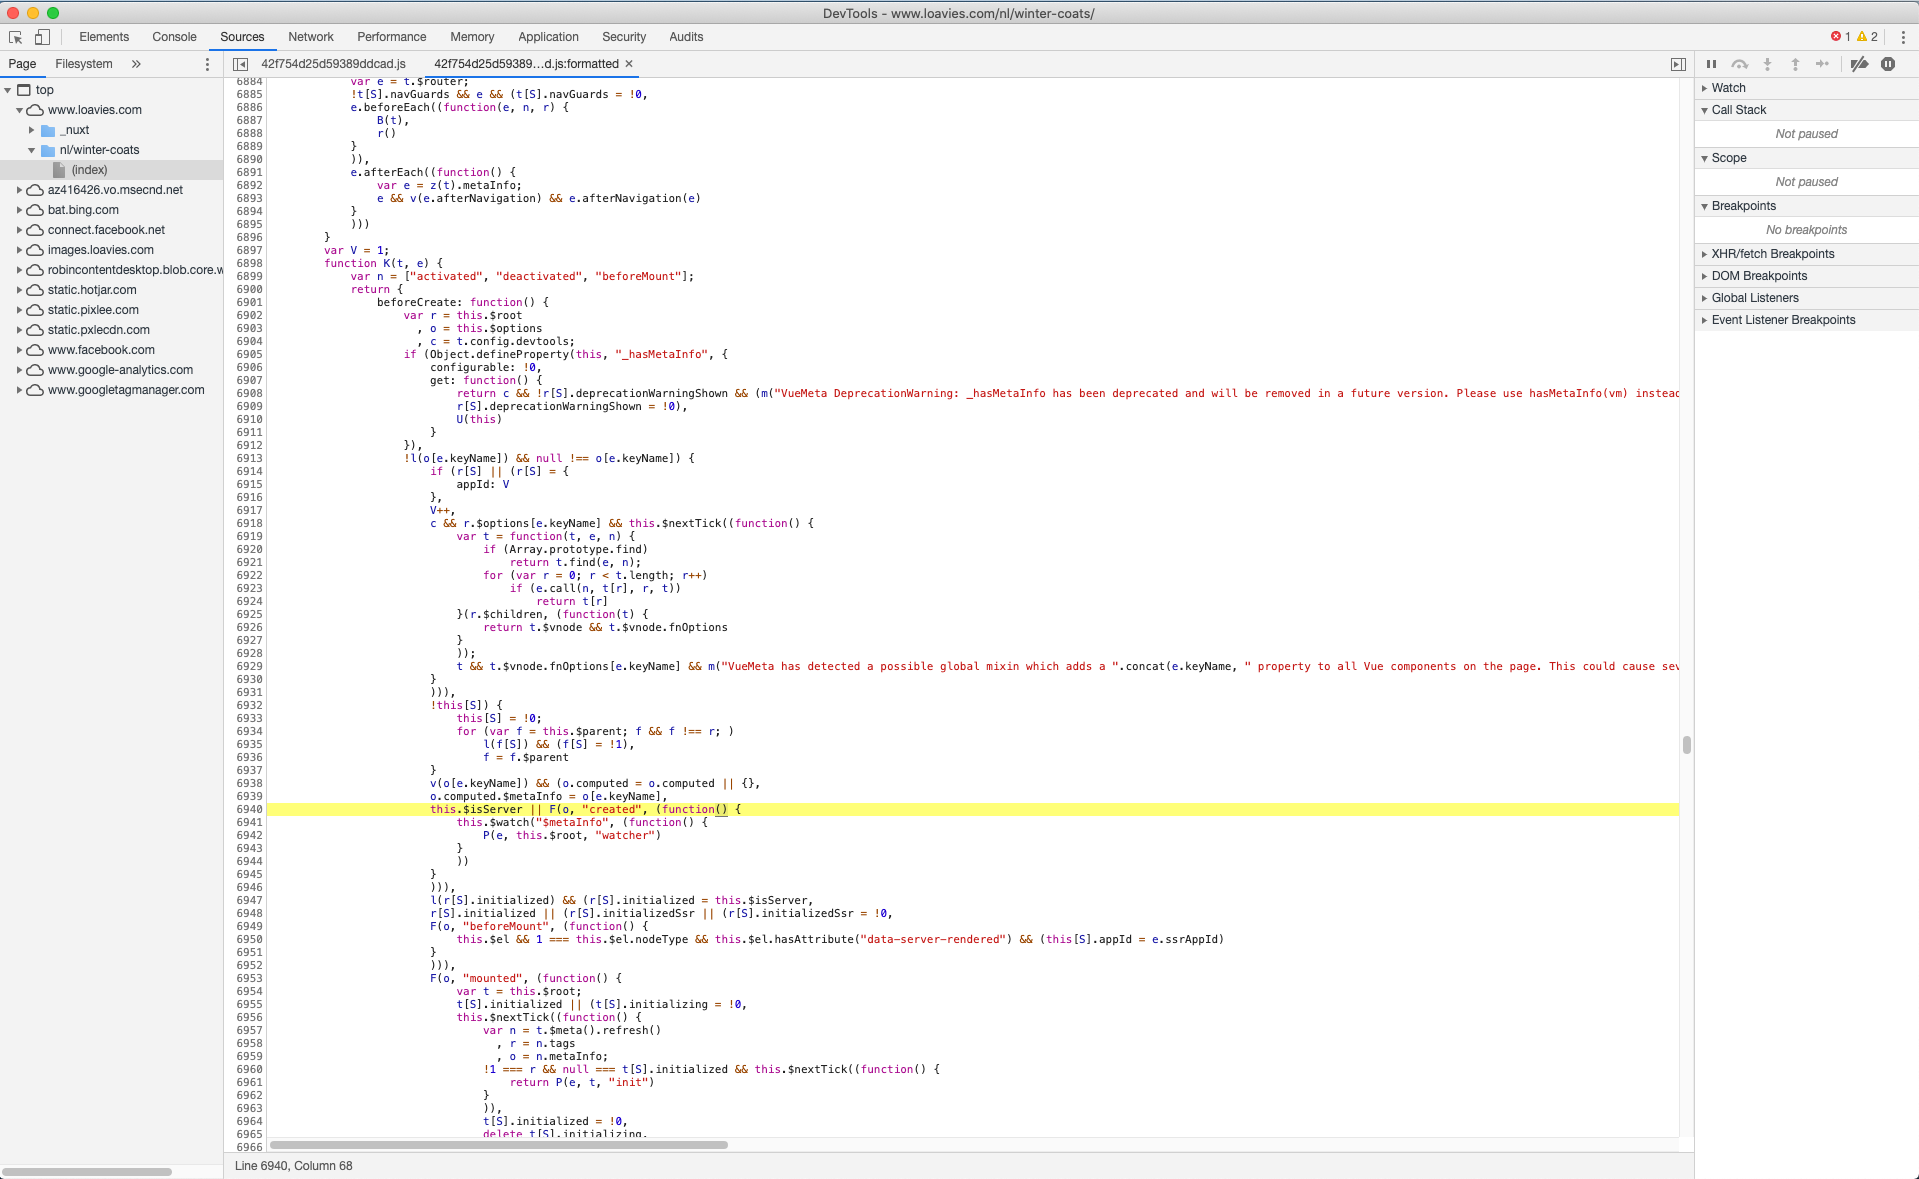
This time it is less obvious where the problem is coming from, but if we read the minified source responsible for the detached DOM nodes, we find references to Vue Meta, responsible for keeping state in sync with head elements.
See below the prettified minified source code, where the line responsible for keeping references to DOM nodes results in detached nodes not being garbage collected.
Let's validate again whether removing Vue Meta will fix the leak.
See the image below of a memory report after removing GTM and Vue Meta.
As you can see the memory report shows no leakage over page navigations. However we did removed some critical functionality from our application and the marketing department is already on it's way with pitchforks to the basement.
Step 5: Fix
Patch Vue Meta
We've happily used Vuejs and NuxtJS in many of projects. And are really grateful for all the hard the work. Hopefully we can work together in the future in solving this issue. Let us propose a change:
Patching Vue Meta was pretty straightforward, because we were able to find the problem in Vue Meta. We notified the developers and proposed a change to their code. While we wait for a reaction of the Vue Meta developers we use the patched version of Vue Meta for now until the issue is fixed in the original package.
Remove Google Tag Manager element references
In order to solve the problem in GTM we need to lose references in GTM events to DOM nodes. We have no clue why all these DOM nodes need to be passed back to GTM, but we want to get rid of them. There are 3 different possibilities to lose those references:
- We try setting up GTM in a way that DOM nodes or references to elements to the page are not send back to the reporting tool.
- When saving the event to the GTM dataLayer in the code we remove the reference to the element.
Something like this:
window.dataLayer.push = function (event) {
  event['gtm.element'] = undefined;
  return Array.prototype.push.apply(this, arguments);
}- We clone the node so that we leave out the parent nodes and all event listeners. But we still send some sort of reference of the DOM node back.
Hooray for the flexibility of Javascript:
window.dataLayer.push = function (event) {
  if(event['gtm.element']) {
    event['gtm.element'] = event['gtm.element'].cloneNode(true);
  }
  return Array.prototype.push.apply(this, arguments);
}
Currently we choose option 3 as this fixes the issue and we still pass something related to the DOM node back to GTM. We must admit that that we are unsure what the outcome is on whatever GTM is used for by our client.
Result
Using patched Vue Meta and patching the push method on window.dataLayer we got the following result:
Aaaaah, I love the smell of fresh air after work!
Conclusion
In a more traditional architecture with server side rendering and refreshes on page navigation memory leaks are less of a problem. Probably your application has one or two as well. These memory leaks are less likely to produce problems for your end users because memory is cleared upon page navigations. While we tend to move to client side routing in order to get a more "appy" feel, we introduce new challenges, like memory leaks.
Our 2 cents: When doing client side routing, monitor you memory usage or refresh the page once in a while :)