This post is pretty old, and might contain outdated advice or links. We’re keeping it online, but recommend that you check newer posts to see if there’s a better approach.
All blog postsArchitecture is important for high quality software, but can be hard to grasp or communicate about. At De Voorhoede we write our architecture as text-based diagrams, so our team and their AI agents read the same thing.
When I presented my Master thesis to graduate as an architect and engineer at Delft University of Technology, one of my professors had one key point of critique: to me, everything was a system. I didn't really take it as a critique. If anything, I took it as a compliment :). Of course there's much more to designing a building than systematics. But I've always been drawn to how the parts fit together.
Today I work as a software architect, and I value that habit more than ever. In software, architecture determines how easily an application can scale and adapt to change. Good architecture keeps complexity low and manageable. And it makes working as a team easier: new people onboard faster, and it's easier to exchange ideas and communicate about how things work and why.
At the same time, software architecture is abstract. You can't walk through it like a building. That makes it hard to reason about, and even harder to communicate. That's where diagrams come in. To me, a good system diagram tells a thousand words: which components there are, how they work together, which way data flows and in what order things happen.
I love drawing them on a whiteboard. But a whiteboard drawing is a snapshot. It doesn't change when the code changes, it's hard to share, and it's impossible to collaborate on when half the team works remotely. And these days, part of the team can't see the whiteboard at all: the AI agents we work with.
So how do we move from a whiteboard to something we can all work with?
From Whiteboard to Repository
Whiteboard sessions are where architecture comes to life. A few boxes, some arrows, someone grabs the marker to redraw a line, and suddenly everyone in the room sees the same system. But the moment the session ends, the drawing starts losing its value. Someone takes a photo, it ends up in a chat thread, and that's usually the last time anyone looks at it.
The obvious next step is to go digital. Online whiteboards like Miro, diagram tools like draw.io, or a Figma export pasted into a wiki. That solves sharing and (remote) collaboration. But it doesn't solve the bigger problem: drift.
A diagram that lives outside the code doesn't change when the code changes. Committing it to the repository as an image doesn't help: you can't diff a PNG or review it in a pull request. Ideally, a diagram lives next to the code and changes along with it, just like a README.
What if we could write a diagram like we write code?
Mermaid: Diagrams as Text
Mermaid is a text syntax for diagrams. You describe the parts and how they connect, and Mermaid draws the diagram for you: flowcharts, sequence diagrams, state diagrams, entity relationships and more. A few lines of text like these:
```mermaidflowchart LR Browser -- "load app" --> Server Server -- "query data" --> DB[(Database)]```
Render as:
Because it's plain text, the diagram lives in a Markdown file right next to the code. You can diff it, review it in a pull request and trace its history. And it renders almost everywhere you'd want to read it: on GitHub and GitLab, in code editors, in my favourite note-taking app Obsidian (and others like Notion), in AI assistants like Claude, and on websites using Mermaid.js, like this one.
There are alternatives, like PlantUML, D2 and Structurizr, some more expressive than Mermaid. But none are as widely supported, and for documentation that's what matters most. That's why we've been using Mermaid at De Voorhoede for years.
But these days, my colleagues aren't the only ones I draw diagrams with.
A Shared Language for People and AI Agents
Our coding agents read the repository before they write code. While these agents can interpret images, text is more token efficient. And unlike a PNG or SVG, a Mermaid diagram describes the system without visual noise. It's the same document for people and agents.
And agents don't just read diagrams, they write them. When I discuss architecture with an AI assistant, I ask it to sketch the system in Mermaid. The diagram becomes our shared reference: a quick way to check whether it understood the system the way I do.
Diagrams also work well alongside rules. In a project I'm working on, the architecture docs pair the diagrams with a short list of rules, like "Update these diagrams in the same PR that changes the architecture." An AGENTS.md file points agents to these docs, so they follow the same rules as the team.
To avoid agents drawing too many nodes and vague labels, we give them the same diagramming guidelines we teach our team (more on that below).
So what does that look like in practice?
Three Diagrams We Use All the Time
The examples below come from one of our projects: a web app combining React Admin with Supabase and Cloudflare. Each diagram answers a different question.
Decision Diagram: Where Should This Logic Live?
For architectural choices that come up over and over again, we draw a decision tree that a new developer, or an agent, can follow on their own.
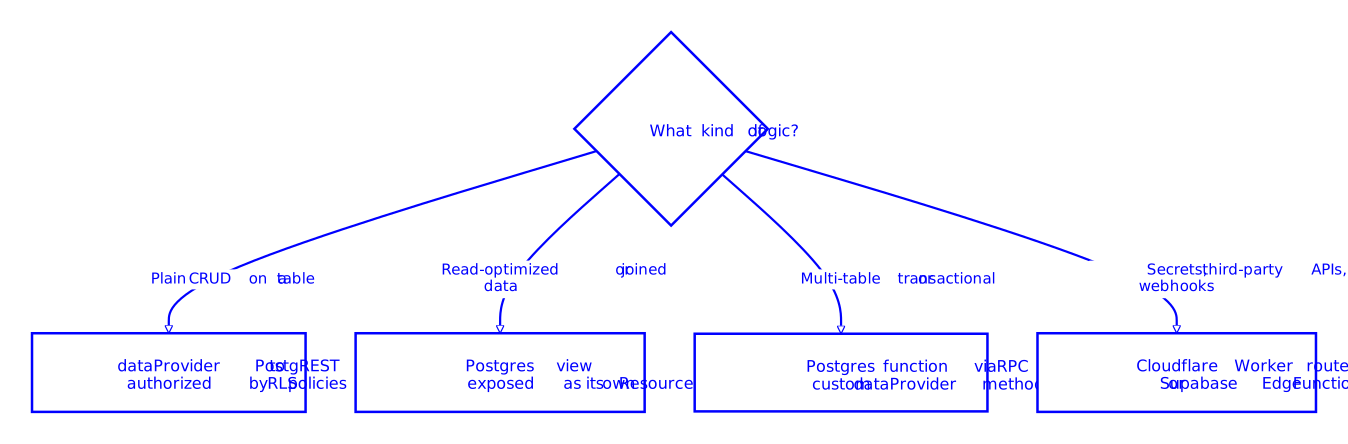
I wrote about these kinds of architecture decisions before in How close to the user should your code be?
Deployment Workflow: PR Preview with Database Changes
Every pull request in this project gets its own preview. When a PR changes the database, it also gets its own database branch, so reviewers can test the changes without touching shared data.
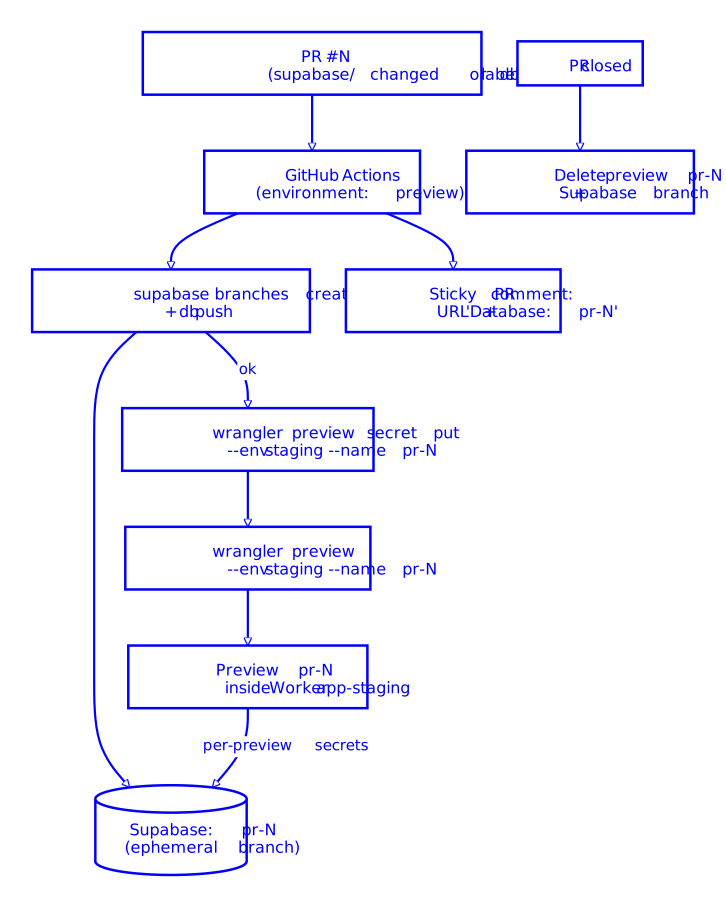
The diagram shows the order that matters: database first, then secrets, then the preview. The preview only deploys if the migration succeeded. And when the PR closes, both are cleaned up. We draw one diagram per environment, which makes differences easy to spot. A PR preview without database changes, for example, skips the branch and shares the staging database.
Request Flow: Reading a List
For runtime behaviour, sequence diagrams work better. They show who calls whom, in what order, and with what. This one shows what happens when the app loads a list of orders.
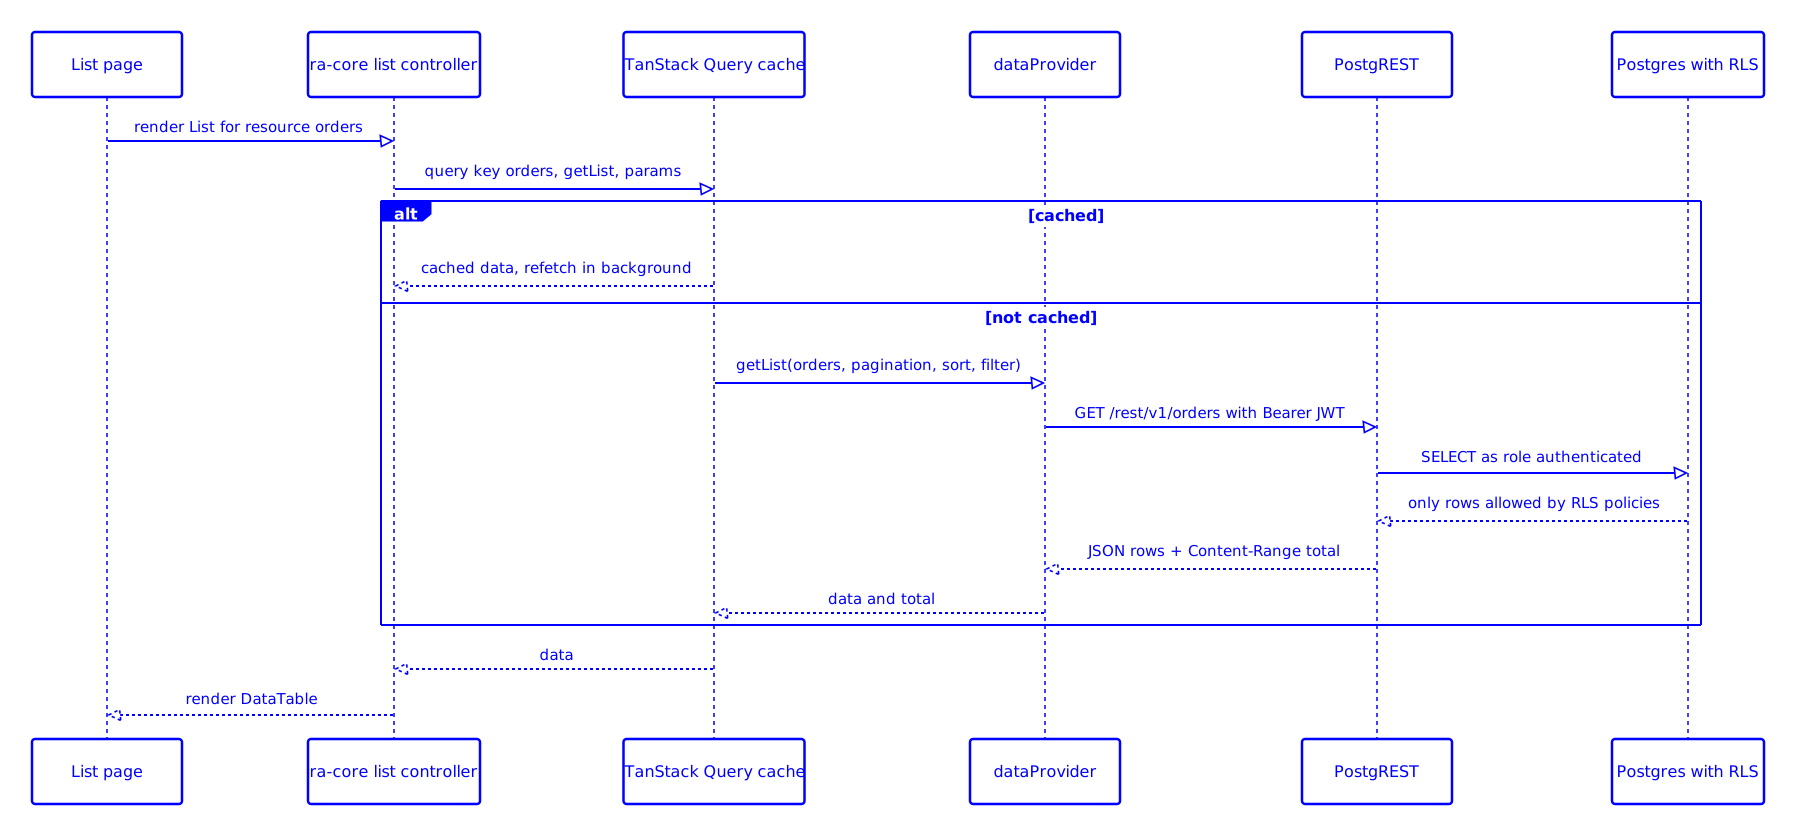
Notice the cache branch, the user's token being passed along, and where authorization happens: the database filters the rows, not the frontend. Those details are easy to forget, and the diagram makes them explicit.
For a public example of one of our projects, see the README of the TU Delft Spacefinder. Its diagrams show the architecture and how data flows at build time versus run time. We added a sprinkle of Voorhoede theming to them too, for the people reading them (the agents don't mind).
Drawing diagrams like these is a skill, and one we wanted everyone on the team to have.
Diagramming as a Team
A few years ago I gave a code class, part of our internal teaching series, on system diagramming with Mermaid. The goal was for everyone on the team to be able to read, write and review diagrams in our projects. The practices from that class are still how we work, and they're the same guidelines we now give our agents:
-
One question per diagram. A diagram that answers one question is easier to read and easier to keep up to date.
-
Keep it small. Roughly 15 nodes or fewer. If it grows beyond that, split it.
-
Label edges with verbs. "publish", "subscribe" or "query data" tell you more than a bare arrow.
-
Use shapes consistently. For example, a cylinder for every data store.
-
Use subgraphs for boundaries. Like a cloud provider, a back-end, or build time versus run time.
-
Add a few sentences of text. The diagram shows how things connect, the text explains why.
-
Update diagrams in the same PR. When the architecture changes, the diagram changes with it.
Mermaid has its limits too. You have little control over the layout, large diagrams quickly become hard to follow, and rendering differs slightly between platforms. It's not a tool for pixel-perfect visuals. But for documenting how a system works, that's rarely what you need.
Everything Is (Still) a System
The whiteboard is still my favourite place to think about architecture together. But once we've figured something out, we write it down in Mermaid, in the repository, next to the code it describes.
That's what it comes down to: treat diagrams like code. Version them, review them, and change them along with the system they describe. That keeps them useful, both for the people on our team and for the agents working alongside them.
This post is also available as Markdown (see "Copy page" at the top), with the diagrams included as text. So if you'd like to discuss it with your own AI assistant, it can read them too.
Architecture is the system behind the screen. In my next post, I'll look at the screen itself: how we describe UI designs as ASCII wireframes, for people and AI agents alike.